
Population structure of purpleback flying squid (Sthenoteuthis oualaniensis) in Nansha area in spring
-
摘要:
种群问题是渔业生物学研究的基础。根据2011年春季罩网渔船调查数据,研究了南沙海域鸢乌贼(Sthenoteuthis oualaniensis)的种群组成、胴长分布、雌雄比例、性腺发育等种群结构特征。结果显示:1)南沙海域存在中型和微型2个鸢乌贼种群,分别占渔获总尾数的88.92%和11.08%,微型种群渔获量少但也遍布整个调查海域;2)中型和微型种群渔获胴长范围分别为69~231 mm和51~125 mm,2个种群雌性的平均胴长均大于雄性;3)中型和微型种群中雌性个体分别占48.48%和61.88%,2个种群不同胴长组性比随着胴长的增加变化规律相似,即由开始阶段雌雄基本接近,到雄性个体占优,再到雌性个体占优,直至全部为雌性;4)微型种群性腺发育早于中型种群,雄性个体性腺发育早于雌性个体,雌、雄初次性成熟胴长(ML50%)中型种群分别为179.7 mm和125.6 mm,微型种群分别为94.8 mm和81.1 mm。鸢乌贼雌雄比例的变化与雄性个体的生长发育密切相关。
Abstract:Research on fish population is foundamental for studies on fishery biology. Based on the survey data of purpleback flying squid (Sthenoteuthis oualaniensis) collected by Chinese falling-net vessels in Nansha area of the South China Sea during April to May in 2011,we studied the population composition,mantle length distribution,sex ratio and maturity of S.oualaniensis in that area. The results show that two populations of S.oualaniensis existed in Nansha area. The medium-form and dwarf-form individuals accounted for 88.92% and 11.08% of the total catches,respectively. The dwarf-form population was less abundant but occurred throughout the survey area. Mantle length (ML) of S.oualaniensis ranged from 69 mm to 231 mm for medium-form population and from 51 mm to 125 mm for dwarf-form population,respectively. The average ML of females was higher than that of males for two populations. The females accounted for 48.48% and 61.88% in the medium-form and dwarf-form populations,respectively. The variation of sex ratio by different ML groups was similar for two populations. The sex ratio of females to males was approximately the same among young squids with increasing ML,i.e.,males were first dominant,then were females and finally there were all females. The maturity stage of dwarf-form population was higher than that of medium-form population. The maturity stage of males was higher than that of females for two populations. By fitting Logistic function,the MLs at first maturity for females and males of medium-form population were 179.7 mm and 125.6 mm,respectively;and those for females and males of dwarf-form population were 94.8 mm and 81.1 mm,respectively. It is suggested that the variation of sex ratio is closely related to the growth and maturity of males.
-
Keywords:
- Sthenoteuthis oualaniensis /
- population structure /
- Nansha area /
- spring
-
鸢乌贼(Sthenoteuthis oualaniensis)隶属枪形目、开眼亚目、柔鱼科、鸢乌贼属,广泛分布于印度洋、太平洋的热带和亚热带海域,其中在南海和印度洋西北部海域数量较大[1-2]。鸢乌贼具有非常复杂的种群结构。NESIS[3]将其分为大型种群、单内壳叶柄侧轴中型种群、双内壳叶柄侧轴中型种群(典型的鸢乌贼种群)、小型种群、微型种群等5个种群,后3个种群主要分布于太平洋海域。微型种群背部没有发光器官,主要分布在10°N~10°S的赤道海域,分布区域与双内壳叶柄侧轴中型种群重叠[4]。国内外学者已对印度洋西北海域鸢乌贼的种群结构、年龄和生长等做了较为深入的研究[2-7]。
南海的鸢乌贼主要分布于南海中南部海盆区,已成为当前南海外海渔业开发的热点[8]。东南亚渔业开发中心(SEAFDEC)、中国台湾和大陆都曾开展过南海鸢乌贼资源调查,并对其资源量分布、年龄与生长等生物和生态学习性进行过研究[9-18]。SEAFDEC在菲律宾西部海域的调查发现,南海存在中型和微型2个鸢乌贼种群,微型种群早熟且无背发光器,胴长范围9.8~12 cm,中型种群具背发光器,胴长范围12~24 cm[15]。颜云榕等[13]研究了西中沙海域鸢乌贼夏季渔业生物学,发现雌性个体出现2个性腺发育高峰期,即101~120 mm(小型个体,胴部较硬,胴背无卵圆形光斑)与161 mm以上(中型个体,胴部柔软,胴背有卵圆形光斑)胴长组。种群问题是渔业生物学研究的基础,文章根据2011年春季灯光罩网渔船南沙探捕所获资料,研究了南沙海域鸢乌贼的种群组成、胴长分布、雌雄比例、性腺发育等种群结构特征,旨在为今后深入开展南海鸢乌贼生物学研究、合理开发利用资源提供参考依据。
1. 材料与方法
1.1 资料来源
资料来源于2011年春季南海中南部海域的灯光罩网调查。调查船为“桂防渔96886”,钢质,总长41.80 m,总吨位413 GT;渔船主机1台,功率382 kW,发电机2台,功率分别为200 kW和150 kW,配340盏(×1 kW)金属卤化物集鱼灯及HE-670型垂直探鱼仪,包括船长在内船员7人,渔获加冰冷藏保存。调查所用罩网网具沉子纲长280.0 m,拉直高度82.5 m,网衣最大网目3.5 mm,网囊最小网目2.0 mm。
1.2 调查方法与数据处理
整个调查为生产性探捕,不设具体调查站位。航次时间为2011年4月19日~5月6日,历时26 d,作业18晚,作业海域范围9°39′N~14°54′N、113°16′E~115°30′E,其中前16晚在南沙海域(12°N以南)作业,后2晚是返航途中在中沙海域生产。
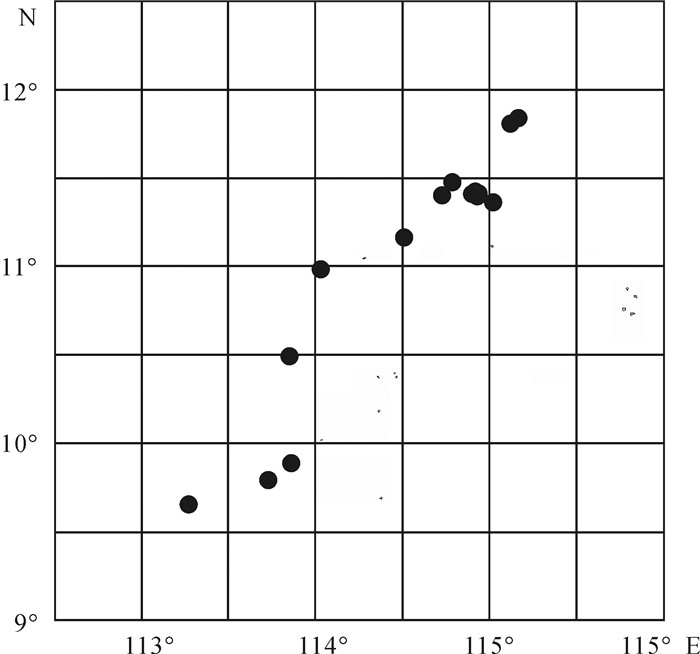
渔船每晚作业10~16网次不等,记录每个网次的渔获组成,每晚选择部分网次随机抽取50尾鸢乌贼进行种群、性别和胴长测定,部分网次解剖观测性腺成熟度和摄食强度。根据胴背发光器官的有无和性腺发育的快慢[3, 15],将鸢乌贼分成中型和微型2个种群;根据左侧第4腕是否茎化和性腺结构的差异[1, 5],进行鸢乌贼雌雄的判别;胴长用精度为1 mm的量鱼板测定;参照刘必林[5]将鸢乌贼性腺成熟度划分为性未成熟(Ⅰ期和Ⅱ期)、性成熟(Ⅲ期和Ⅳ期)、产卵后(Ⅴ期)5期3个阶段。因为第1晚的鸢乌贼渔获未按种群分开,文章仅对12°N以南海域15个夜晚的数据进行分析,具体采样站位见图 1。
以10 mm组距对胴长进行分组,例如100 mm胴长组表示胴长范围96~105 mm;运用t检验比较2个种群和雌雄个体之间的胴长分布是否存在显著性差异;运用D检验(Kolmogorov-Smirnov检验)分析胴长组成是否符合正态分布;利用适合性卡方(χ2)测验,验证鸢乌贼的雌雄比例是否与1 : 1的理论比例相符;利用不同胴长组性成熟个体百分比拟合Logistic曲线,分种群和性别推算鸢乌贼的初次性成熟胴长[19]:
$$ {P_i} = \frac{1}{{1 + {{\rm{e}}^{ - \left( {a + b{L_l}} \right)}}}};\quad M{L_{50\% }} = - \frac{a}{b} $$ 式中Pi为成熟个体占组内样本的百分比;Li为胴长组,ML50%为初次性成熟胴长(mm)。
2. 结果
2.1 种群组成
调查船15个夜晚作业194网次(表 1),平均每晚作业12.9网,合计捕捞鸢乌贼68.06 t,网次产量为28.5~1 282.5 kg,平均为350.8 kg [标准差(SD)=237.3 kg],每晚产量为1.54~10.94 t,平均为4.54 t(SD=2.69 t)。鸢乌贼每个网次都有捕获,但网次和每晚产量的变幅较大。随机观测了119网次5 964尾鸢乌贼的种群、性别和胴长。中型种群占抽样总尾数的88.92%,胴背有发光器官,性成熟个体较大;微型种群占抽样总尾数的11.08%,胴背无发光器官,性成熟个体较小。中型种群是南沙海域鸢乌贼的优势种群。微型种群15个夜晚都有捕获,占每晚抽样尾数的2.75%~30.29%;在119个抽样网次中出现110次,占网次抽样尾数的0~72.00%。微型种群每晚和网次所占比例的变幅较大。
表 1 取样站位和鸢乌贼渔获概况Table 1. Sampling stations and catches of S.oualaniensis夜晚
No.日期
date作业地点 position 作业网次
fishing times产量/t
yield抽样网次
sampling times抽样尾数/尾
sampling number微型占比/%
drawf-form/totalLat.(N) Long.(E) 1 04-20 114°44′ 11°24′ 10 1.65 4 200 4.00 2 04-21 114°02′ 10°59′ 13 3.33 13 651 4.30 3 04-22 114°31′ 11°10′ 10 1.54 10 501 12.57 4 04-23 113°52′ 09°53′ 12 3.90 10 501 3.59 5 04-24 113°44′ 09°48′ 12 2.91 9 453 5.30 6 04-25 113°16′ 09°39′ 15 3.59 10 505 15.84 7 04-26 113°51′ 10°29′ 12 2.68 6 302 16.56 8 04-27 115°01′ 11°22′ 16 5.10 8 401 19.95 9 04-28 115°07′ 11°51′ 14 10.94 7 349 10.32 10 04-29 115°10′ 11°50′ 13 4.62 7 351 16.52 11 04-30 115°07′ 11°49′ 11 3.08 7 350 30.29 12 05-01 114°56′ 11°25′ 13 6.90 7 350 3.14 13 05-02 114°54′ 11°25′ 16 5.87 7 350 18.29 14 05-03 114°56′ 11°24′ 16 9.15 8 400 2.75 15 05-04 114°55′ 11°25′ 11 2.79 6 300 8.00 2.2 胴长分布
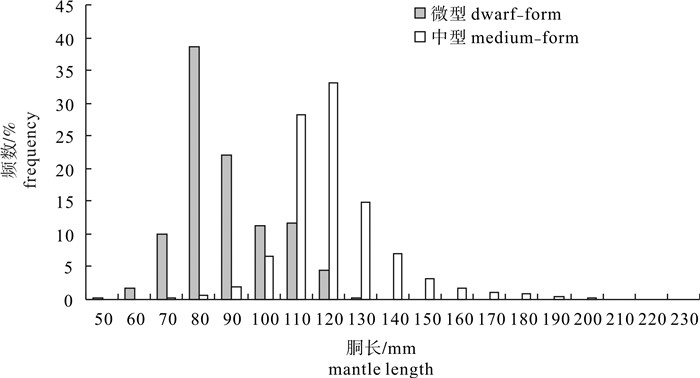
鸢乌贼中型种群渔获胴长范围为69~231 mm,平均胴长为121.4 mm(SD=16.4 mm);微型种群渔获胴长范围为51~125 mm,平均胴长为88.6 mm(SD=13.4 mm)。2个种群的胴长分布有重叠,中型种群的胴长分布范围和平均胴长明显大于微型种群(图 2和表 2)。t检验表明,2个种群的胴长分布存在显著性差异(P<0.05)。D检验表明,中型和微型种群的胴长组成均不呈正态分布(P<0.05)。
![]() 图 2 中型和微型种群鸢乌贼胴长分布Figure 2. Distribution of mantle length of medium-form and dwarf-form S.oualaniensis表 2 鸢乌贼渔获胴长组成Table 2. Composition of mantle length of S.oualaniensis
图 2 中型和微型种群鸢乌贼胴长分布Figure 2. Distribution of mantle length of medium-form and dwarf-form S.oualaniensis表 2 鸢乌贼渔获胴长组成Table 2. Composition of mantle length of S.oualaniensis种群
population性别
sex尾数
number胴长范围/mm
mantle length range优势胴长 dominant mantle length 平均胴长/mm
average mantle length标准差/mm
SD范围/mm 比例/% 中型 medium-form 雌性 2 571 71~231 110~140 82.77 125.5 20.1 雄性 2 732 69~153 100~130 93.23 117.5 10.3 合计 5 303 69~231 100~140 90.01 121.4 16.4 微型 dwarf-form 雌性 409 56~125 80~110 86.31 93.5 14.1 雄性 252 51~104 70~90 95.24 80.8 6.9 合计 661 51~125 70~110 94.40 88.6 13.4 中型种群雌性平均胴长125.5 mm(SD=20.1 mm),雄性平均胴长117.5 mm(SD=10.3 mm);微型种群雌性平均胴长93.5 mm(SD=14.1 mm),雄性平均胴长80.8 mm(SD=6.9 mm)。2个种群雌性的胴长分布范围和平均胴长均大于雄性。t检验表明,2个种群雌、雄个体之间的胴长分布均存在显著性差异(P<0.05)。
2.3 雌雄比例
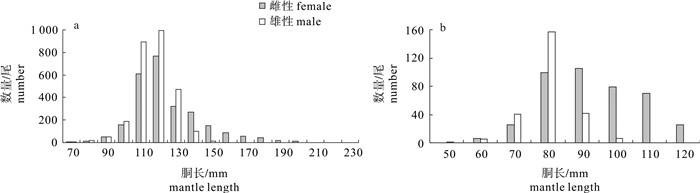
随机抽样的5 303尾中型种群鸢乌贼中,雌性个体占48.48%。卡方检验结果显示,总性比符合1 : 1的关系,雌雄组成无显著差异(P>0.05);70 mm、80 mm、90 mm和100 mm胴长组中,雌性个体分别占55.56%、46.88%、48.48%和45.53%,雌雄组成均无显著差异(P>0.05);110 mm、120 mm、130 mm、140 mm和150 mm体长组中,雌性个体分别占40.51%、43.64%、40.40%、73.58%和90.96%,雌雄组成均有显著差异(P<0.05)。70~100 mm胴长组,雌雄比例接近;110~130 mm胴长组,雄性个体明显多于雌性;140 mm胴长组开始,雌性个体明显多于雄性;160 mm胴长组以上全为雌性(图 3-a)。D检验表明,中型种群雌雄胴长组成均不呈正态分布(P<0.05),雌性胴长分布的偏度系数(skewness)为1.16,分布为右偏,雄性胴长分布的偏度系数为-0.22,分布为左偏。
![]() 图 3 鸢乌贼中型(a)和微型(b)种群渔获性别组成Figure 3. Sex composition of medium-form (a) and dwarf-form (b) S.oualaniensis
图 3 鸢乌贼中型(a)和微型(b)种群渔获性别组成Figure 3. Sex composition of medium-form (a) and dwarf-form (b) S.oualaniensis随机抽样的661尾微型种群鸢乌贼中,雌性个体占61.88%。卡方检验结果显示,总性比不符合1 : 1的关系,雌性个体明显多于雄性(P<0.05);60 mm和70 mm胴长组中,雌性个体分别占54.55%和37.88%,雌雄组成均无显著差异(P>0.05);80 mm、90 mm和100 mm体长组中,雌性个体分别占38.67%、71.43%和92.94%,雌雄组成均有显著差异(P<0.05)。50~70 mm胴长组,雌雄比列接近;80 mm胴长组,雄性个体明显多于雌性;90 mm胴长组开始,雌性个体明显多于雄性,110 mm胴长组以上全为雌性(图 3-b)。D检验表明,微型种群雌、雄胴长组成均不呈正态分布(P<0.05),雌性胴长分布的偏度系数为0.10,分布为右偏,雄性胴长分布的偏度系数为-0.35,分布为左偏。
总体而言,鸢乌贼2个种群不同胴长组性比表现出相似的规律性:随着胴长的增加,雌雄比例由开始阶段的基本接近,到雄性个体占优,再到雌性个体占优,直至全部为雌性。2个种群雌性和雄性的胴长组成均不呈正态分布,雌性胴长分布都为右偏,雄性胴长分布都为左偏。
2.4 性腺发育
调查期间,合计解剖观测了3 833尾鸢乌贼(中型种群3 182尾,微型种群651尾)的性腺成熟度,其中随机抽样3 363尾(中型种群2 926尾,微型种群437尾,分属68个网次,抽样渔获全部解剖),非随机抽样470尾(中型种群256尾,微型种群214尾,分属51个网次,抽样渔获少量解剖,小个体渔获为主,解剖主要是为了确定抽样个体的种群或雌雄)。
随机抽样的3 363尾鸢乌贼中,中型种群性成熟个体占15.07%,微型种群性成熟个体占42.11%,微型种群的性腺发育明显早于中型种群(表 3)。中型种群雌性和雄性中性成熟个体分别占5.12%和24.29%,微型种群雌性和雄性中性成熟个体分别占39.51%和45.36%,2个种群雄性个体的性腺发育都早于雌性个体。2个种群都未捕到产卵后(Ⅴ期)个体。
表 3 鸢乌贼性腺成熟度组成Table 3. Composition of sex maturity of S.oualaniensis种群
population性别
sex样本数/尾
number性腺成熟度/% sexual maturity 性未成熟
immature性成熟
mature产卵后
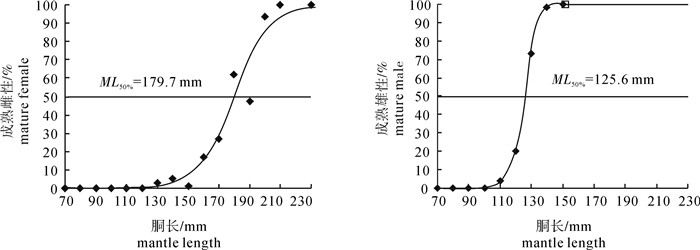
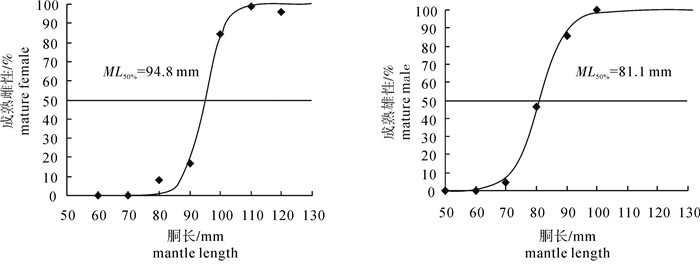
spawned中型 medium-form 雌性 1 407 94.88 5.12 0 雄性 1 519 75.71 24.29 0 合计 2 926 84.93 15.07 0 微型 dwarf-form 雌性 243 60.49 39.51 0 雄性 194 54.64 45.36 0 合计 437 57.89 42.11 0 解剖观测的3 833尾鸢乌贼中,中型种群雌、雄性成熟个体最小胴长分别为123 mm和111 mm,雌、雄性未成熟个体最大胴长分别为199 mm和133 mm;微型种群雌、雄性成熟个体最小胴长分别为80 mm和73 mm,雌、雄性未成熟个体最大胴长分别为123 mm和92 mm。根据不同胴长组的性成熟个体百分比,拟合推算了鸢乌贼初次性成熟胴长(图 4和图 5)。
![]() 图 4 中型种群鸢乌贼初次性成熟胴长Figure 4. Mantle length at first maturity of medium-form S.oualaniensis
图 4 中型种群鸢乌贼初次性成熟胴长Figure 4. Mantle length at first maturity of medium-form S.oualaniensis![]() 图 5 微型种群鸢乌贼初次性成熟胴长Figure 5. Mantle length at first maturity of dwarf-form S.oualaniensis
图 5 微型种群鸢乌贼初次性成熟胴长Figure 5. Mantle length at first maturity of dwarf-form S.oualaniensis中型种群雌、雄个体的性成熟度-胴长曲线分别为:
雌性:${P_i} = \frac{1}{{1 + {{\rm{e}}^{ - \left( { - 15.45\;2 + 0.086{L_i}} \right)}}}}\;\;\;\;\left( {{R^2} = 0.963, \;\;n = 576} \right) $;
雄性:${P_i} = \frac{1}{{1 + {{\rm{e}}^{ - \left( { - 29.89\;3 + 0.238{L_i}} \right)}}}}\;\;\;\;\left( {{R^2} = 0.998, \;\;n = 606} \right) $;
中型种群初次性成熟胴长(ML50%),雌性为179.7 mm,雄性为125.6 mm。
微型种群雌、雄个体的性成熟度-胴长曲线分别为:
雌性:${P_i} = \frac{1}{{1 + {{\rm{e}}^{ - \left( { - 29.87\;7 + 0.315{L_i}} \right)}}}}\;\;\;\;\left( {{R^2} = 0.995, \;\;n = 401} \right) $;
雄性:${P_i} = \frac{1}{{1 + {{\rm{e}}^{ - \left( { - 18.16\;1 + 0.224{L_i}} \right)}}}}\;\;\;\;\left( {{R^2} = 0.998, \;\;n = 250} \right) $;
微型种群初次性成熟胴长(ML50%),雌性为94.8 mm,雄性为81.1 mm。
3. 讨论
3.1 南沙海域鸢乌贼种群和雌雄判别
NESIS[3]将分布在太平洋和印度洋海域的鸢乌贼分为3个主要种群和2个次要种群。大型种群仅分布在印度洋北部的红海、亚丁湾和阿拉伯海,在阿拉伯海其胴长为400~500 mm,最大胴长为650 mm;中型种群存在于整个鸢乌贼种群分布区域内,成熟雄性胴长为120~150 mm,成熟雌性胴长为190~250 mm;微型种群分布在赤道附近,无背发光器,成熟雄性胴长为90~100 mm,成熟雌性胴长为90~120 mm,最大胴长为140~150 mm。中型种群根据内壳特征(双或者单内壳叶柄侧轴)又可以分为2个群体,其中单内壳叶柄侧轴群体仅出现在红海、阿丁湾和阿拉伯海15°N~17°N海域。小型种群形态近似中型种群,但性成熟个体更小,雌性胴长范围为90~160 mm,成熟胴长为120~140 mm,近似于微型种群,该种群主要分布在东热带太平洋和西印度洋。微型种群具有许多与中型种群相区别的形态学特征,如微型种群的胴背部没有发光器官、茎化腕的差异以及精囊结构和叶柄侧轴结构的差异等[4]。在仔稚鱼和幼鱼阶段,微型种群与中型种群在形态和外观上不存在差异,因此,以往的研究者并不赞同把微型种群划分为另外一个种类[4, 20],但STAAF等[21]对中太平洋海域鸢乌贼分子系统学的研究显示,微型和中型种群之间的遗传差异较大,可能已达到物种水平。
该研究根据胴背发光器的有无,结合性腺发育的快慢,将南沙海域的鸢乌贼分为中型和微型2个种群。调查中发现,中型种群胴长大于120 mm的个体,胴背发光器官呈明显的黄色椭圆形斑块,胴长小于120 mm的个体,发光器官则不明显,容易误判为微型种群,但仔细观察胴背位置仍可发现密布的淡白色小斑点;解剖也可发现,微型种群的性腺发育要明显早于相同胴长的中型种群。鸢乌贼雄性个体左侧第4腕茎化,但未成熟个体的茎化腕有时并不明显,此时也需观察内部性腺结构判别雌雄;鸢乌贼雄性的精巢从小就清晰可辨,雌性的卵巢在性腺发育成熟时才充实成形。因此,根据外形特征结合解剖观测,可以较为准确的进行鸢乌贼2个种群与雌雄的判别。
该研究参照LABE[15]对菲律宾西部海域鸢乌贼种群的研究,将胴背具发光器官的鸢乌贼都归为中型种群。调查发现的中型种群雌、雄性成熟个体胴长范围分别为123~231 mm和111~153 mm,推算的ML50%胴长分别为179.7 mm和125.6 mm。相比NESIS[3]的分类标准,中型种群性成熟胴长变小,雌性还捕获10尾胴长140 mm以下的性成熟个体,这是由于中型种群对南海水文环境的适应性变化,还是由于混有小型种群等其他鸢乌贼种群,有待深入分析研究。
3.2 采样方法对鸢乌贼渔获种群和性比的影响
SEAFDEC调查船1998年4月~5月在菲律宾西部海域(11°N~20°N,117°E~120°E)的鱿钓调查显示,鸢乌贼是唯一渔获种类,产量合计2 538尾,393.1 kg,自动钓机平均CPUE(单位捕捞努力量渔获量)6尾· (线· h)-1;调查海域存在2个鸢乌贼种群,中型种群胴长范围为12~24 cm,占总尾数的86%(2 175尾,377.5 kg);微型种群胴长范围为9.8~12 cm,占总尾数的14%(363尾,15.6 kg);中型种群中雌性个体占83%,微型种群中雌性个体占70%,雌性明显占优;微型种群每个站位都有捕获(占比2.6%~31.2%),渔获量少但遍布整个调查海域[15]。
与之比较,该次调查也发现南沙海域存在中型和微型2个鸢乌贼种群,分别占总渔获尾数的88.92%和11.08%,中型种群为优势种群,微型种群资源量少但也遍布整个调查海域。这些发现与菲律宾西部海域的调查基本一致。与之不同的是,该次调查中小个体渔获明显增多,98 mm以下个体占总渔获的11.05%,中型种群小于120 mm的个体占53.12%;渔获的雌雄比例相对均衡,中型和微型种群中雌性个体分别占48.48%和61.88%。采样方法的不同应该是造成这种差异的主要原因。SEAFDEC调查是鱿钓取样,而该调查是灯光罩网取样。实践证明,鱿钓作业选择性较强,渔获以大个体为主且雌性居多[6, 11, 17]。颜云榕等[13]2010年6月~7月在南沙北部海域(12°N~16°N,112°E~116°E)开展的自动鱿钓和灯光罩网联合调查也发现,鱿钓和罩网鸢乌贼渔获胴长范围分别为108~215 mm和65~231 mm,雌雄性比分别为32.0和1.4,钓具的总体雌雄比明显较高。ZAKARIA[17]认为,由于小个体鸢乌贼样品的缺失,鱿钓渔获结构无法反映真实的海域资源结构。相对而言,罩网网目尺寸小、选择性差、渔获量大,渔获组成更接近海域资源实际。
调查期间,鸢乌贼微型种群网次和每晚所占比例的变幅较大,即使同个夜晚的相邻网次中也经常出现这种现象。分析原因,一方面是受资源分布时空差异的影响,另一方面也与灯光罩网捕捞方法有关。罩网作业是夜晚通过集鱼灯将捕捞对象诱集至表层后再放网罩扣捕捞,资源分布水层越深逃逸率越高,调查船所用网具的有效捕捞水深约40 m。张引[11] 分析台湾调查船声学数据时发现,当某处存在大个体鸢乌贼时,小个体鸢乌贼倾向栖息于更深水层,当大个体鸢乌贼消失后,小个体鸢乌贼则上升到大个体鸢乌贼原先所在的水层;认为同类相残是小个体鸢乌贼栖息于更深水层的原因,因为它们要避开大个体鸢乌贼的捕食。微型种群鸢乌贼体型较小,栖息水层相对较深,放网时所处水层的不同和逃逸率的差异明显影响其在渔获中所占的比例。该次调查未捕到产卵后(Ⅴ期)个体,推测鸢乌贼产卵后期不再趋光并且栖息于深水层直至死亡,灯光罩网无法有效捕捞,具体还有待进一步验证。
3.3 鸢乌贼不同胴长组性比与性腺发育的关系
历史研究表明,鸢乌贼两性比例会随性成熟及繁殖情况而有变化,在未成熟群体中,性比大体为1 : 1;在繁殖初期,性成熟较早、行动较快的雄性个体先行到达繁殖场,此时雄性的比例甚高于雌性;在繁殖后期,完成交配活动的雄性个体又先行死去,从繁殖场大量消失,此时雌性的比例甚高于雄性[1]。
该研究发现,鸢乌贼中型和微型种群不同胴长组性比表现出相似的规律性:随着渔获胴长的增加,雌雄比例由开始阶段的基本接近,到雄性个体占优,再到雌性个体占优,直至全部为雌性,其中尤以雄性占优到雌性占优的转变过程最为明显(图 3)。陈新军[22]进行新西兰海域双柔鱼研究时有过类似发现,渔获物性别组成生长初期接近1 : 1,成长期雄性个体的比例略占优势,繁殖期雌性个体占优势。该次调查发现的鸢乌贼雄性最小成熟胴长,中型和微型种群分别为111 mm和73 mm,分属110 mm和70 mm胴长组,估算的雄性ML50%胴长,中型和微型种群分别为125.6 mm和81.1 mm,分属130 mm和80 mm胴长组。中型种群70~100 mm和微型种群50~60 mm胴长组,鸢乌贼处于未成熟阶段,此时的雌雄比例接近;中型种群110~130 mm和微型种群70~80 mm胴长组,为雄性鸢乌贼开始性成熟并大规模交配繁殖阶段,此时雄性比例要高于雌性;中型种群140 mm和微型种群90 mm胴长组开始,因为完成交配活动的雄性个体先行死去,雌性比例又开始高于雄性直至全部为雌性。因此,鸢乌贼不同胴长组雌雄比例的变化可能与雄性个体的生长发育密切相关。
该次探捕中每个站位都是成体和幼体混捕,中型种群110~130 mm和微型种群70~80 mm胴长组雄性比例偏高,无法用雄性个体先行到达繁殖场理论解释。ZAKARIA[17]研究发现:南海鸢乌贼的生命周期在1年之内,雌性寿命长于雄性,胴长达到100 mm后雌性个体的生长速度快于雄性。因此,中型种群110~130 mm胴长组雄性比例偏高,可能是由于雌性生长相对较快,导致相应胴长组雄性个体积压所致。微型种群70~80 mm胴长组应该可用同样的理论解释。2个种群雄性胴长分布都为左偏,雌性胴长分布都为右偏,应该也与雌雄个体寿命的长短、生长的快慢有关。
中型和微型种群抽样渔获中雌性个体分别占48.48%和61.88%,卡方检验显示,中型种群雌雄组成无显著差异(P>0.05),微型种群雌雄组成则有显著差异(P<0.05)。南海鸢乌贼的主要产卵季节是夏季[11, 13],该次探捕为春季调查,中型和微型种群中性成熟个体分别占15.07%和42.11%,微型种群的性腺成熟度明显高于中型种群,其中,雄性中性成熟个体所占比例,微型和中型种群分别为45.36%和24.29%。微型种群雌性比例偏高,应该是由于部分雄性个体已完成产卵活动先行死去,中型种群还未到产卵高峰期,雌雄比例相对均匀。因此,鸢乌贼总渔获中雌雄比例的变化也与雄性个体的生长发育密切相关。
-
![]()
图 2 中型和微型种群鸢乌贼胴长分布
Figure 2. Distribution of mantle length of medium-form and dwarf-form S.oualaniensis
![]()
图 3 鸢乌贼中型(a)和微型(b)种群渔获性别组成
Figure 3. Sex composition of medium-form (a) and dwarf-form (b) S.oualaniensis
![]()
图 4 中型种群鸢乌贼初次性成熟胴长
Figure 4. Mantle length at first maturity of medium-form S.oualaniensis
![]()
图 5 微型种群鸢乌贼初次性成熟胴长
Figure 5. Mantle length at first maturity of dwarf-form S.oualaniensis
表 1 取样站位和鸢乌贼渔获概况
Table 1 Sampling stations and catches of S.oualaniensis
夜晚
No.日期
date作业地点 position 作业网次
fishing times产量/t
yield抽样网次
sampling times抽样尾数/尾
sampling number微型占比/%
drawf-form/totalLat.(N) Long.(E) 1 04-20 114°44′ 11°24′ 10 1.65 4 200 4.00 2 04-21 114°02′ 10°59′ 13 3.33 13 651 4.30 3 04-22 114°31′ 11°10′ 10 1.54 10 501 12.57 4 04-23 113°52′ 09°53′ 12 3.90 10 501 3.59 5 04-24 113°44′ 09°48′ 12 2.91 9 453 5.30 6 04-25 113°16′ 09°39′ 15 3.59 10 505 15.84 7 04-26 113°51′ 10°29′ 12 2.68 6 302 16.56 8 04-27 115°01′ 11°22′ 16 5.10 8 401 19.95 9 04-28 115°07′ 11°51′ 14 10.94 7 349 10.32 10 04-29 115°10′ 11°50′ 13 4.62 7 351 16.52 11 04-30 115°07′ 11°49′ 11 3.08 7 350 30.29 12 05-01 114°56′ 11°25′ 13 6.90 7 350 3.14 13 05-02 114°54′ 11°25′ 16 5.87 7 350 18.29 14 05-03 114°56′ 11°24′ 16 9.15 8 400 2.75 15 05-04 114°55′ 11°25′ 11 2.79 6 300 8.00  下载: 导出CSV
表 2 鸢乌贼渔获胴长组成
Table 2 Composition of mantle length of S.oualaniensis
种群
population性别
sex尾数
number胴长范围/mm
mantle length range优势胴长 dominant mantle length 平均胴长/mm
average mantle length标准差/mm
SD范围/mm 比例/% 中型 medium-form 雌性 2 571 71~231 110~140 82.77 125.5 20.1 雄性 2 732 69~153 100~130 93.23 117.5 10.3 合计 5 303 69~231 100~140 90.01 121.4 16.4 微型 dwarf-form 雌性 409 56~125 80~110 86.31 93.5 14.1 雄性 252 51~104 70~90 95.24 80.8 6.9 合计 661 51~125 70~110 94.40 88.6 13.4
下载: 导出CSV
表 3 鸢乌贼性腺成熟度组成
Table 3 Composition of sex maturity of S.oualaniensis
种群
population性别
sex样本数/尾
number性腺成熟度/% sexual maturity 性未成熟
immature性成熟
mature产卵后
spawned中型 medium-form 雌性 1 407 94.88 5.12 0 雄性 1 519 75.71 24.29 0 合计 2 926 84.93 15.07 0 微型 dwarf-form 雌性 243 60.49 39.51 0 雄性 194 54.64 45.36 0 合计 437 57.89 42.11 0
下载: 导出CSV
-
[1] 王尧耕, 陈新军. 世界大洋性经济柔鱼类资源及其渔业[M].北京:海洋出版社, 2005:284-296. https://xueshu.baidu.com/usercenter/paper/show?paperid=57f1b5f4013df538c63ee7185e9bea0a [2] 刘必林, 陈新军, 钟俊生. 采用耳石研究印度洋西北海域鸢乌贼的年龄、生长和种群结构[J]. 大连水产学院学报, 2009, 24(3): 206-212. doi: 10.3969/j.issn.1000-9957.2009.03.004 [3] NESIS K N. Population structure of oceanic Ommastrephids, with particular reference to Sthenoteuthis oualaniensis: a review[C]//Recent advances in Cephalopod fisheries biology. Tokyo: Takai University Press, 1993: 375-383. https://www.semanticscholar.org/paper/Population-structure-of-oceanic-Ommastrephids%2C-with-Nesis/510610895740d037d8d13fbc2fe86ea5a60150f8
[4] 刘金立. 利用形态学和RAPD方法鉴定印度洋西北部海域莺乌贼的种群结构[D]. 上海: 上海水产大学, 2006. https://med.wanfangdata.com.cn/Paper/Detail?id=DegreePaper_Y918053 [5] 刘必林. 利用耳石微结构研究印度洋西北海域莺乌贼的年龄和生长[D]. 上海: 上海水产大学, 2006. https://www.doc88.com/p-3999078058671.html [6] 陈新军, 刘金立. 利用形态学方法分析印度洋西北部海域鸢乌贼种群结构[J]. 上海水产大学学报, 2007, 16(2): 174-179. https://www.doc88.com/p-7317011198694.html [7] CHEN Xinjun, LIU Bilin, TIAN Siquan, et al. Fishery biology of purpleback squid, Sthenoteuthis oualaniensis, in the northwest Indian Ocean[J]. Fish Res, 2007, 83(1): 98-104. doi: 10.1016/j.fishres.2006.09.005
[8] 张鹏, 曾晓光, 杨吝, 等. 南海区大型罩网渔场渔期和渔获组成分析[J]. 南方水产科学, 2013, 9(3): 74-79. doi: 10.3969/j.issn.2095-0780.2013.03.012 [9] SIRIRAKSOPHON S, NAKAMURA Y, NATINEE S. Exploration of purpleback flying squid, Sthenoteuthis oualaniensis resources in the South China Sea[R]. Samutprakan, Thailand: Southeast Asian Fisheries Development Center Training Department, 2001: 1-81. doi: 10.3390/w13010065
[10] SIRIRAKSOPHON S. Experimental fishing on offshore resources in the region: report of the first meeting of the Regional Advisory Committee on Fisheries Management in Southeast Asia, Bangkok, Thailand, 22-24 September, 2008[C]. Bangkok: SEAFDEC Secretariat, 2009: 45-47. https://www.nature.com/articles/s41597-023-02883-9
[11] 张引. 南海产南鱿资源之资源声学研究[D]. 台北: 台湾大学海洋研究所, 2005. [12] 张鹏, 杨吝, 张旭丰, 等. 南海金枪鱼和鸢乌贼资源开发现状及前景[J]. 南方水产, 2010, 6(1): 68-74. doi: 10.3969/j.issn.1673-2227.2010.01.012 [13] 颜云榕, 冯波, 卢伙胜, 等. 南沙群岛北部海域鸢乌贼夏季渔业生物学研究[J]. 海洋与湖沼, 2012, 43(6): 1177-1186. doi: 10.11693/hyhz201206021021 [14] 杨权, 李永振, 张鹏, 等. 基于灯光罩网法的南海鸢乌贼声学评估技术研究[J]. 水产学报, 2013, 37(7): 1032-1039. doi: 10.3724/SP.J.1231.2013.38513 [15] LABE L L. Catch rate of oceanic squid by Jigging method in the South China Sea, Area III: Western Philippines: proceedings of the third Technical Seminar on Marine Fishery Resources Survey in the South China Sea, Area III: Western Philippines, Manila, July 13-15, 1999[C]. Bangkok, Thailand: SEAFDEC, 2000: 19-31. http://repository.seafdec.org/handle/20.500.12066/4341
[16] BASIR S. Biological feature of an oceanic squid, Sthenoteuthis oualaniensis in the South China Sea, Area III: Western Philippines: proceedings of the Third Technical Seminar on Marine Fishery Resources Survey in the South China Sea, Area III: Western Philippines, Manila, July 13-15, 1999[C]. Bangkok, Thailand: SEAFDEC, 2000: 135-147. http://hdl.handle.net/20.500.12066/4349
[17] ZAKARIA M Z. Age and growth studies of oceanic squid, Sthenoteuthis oualaniensis using statoliths in the South China Sea, Area III: Western Philippines: proceedings of the Third Technical Seminar on Marine Fishery Resources Survey in the South China Sea, Area III: Western Philippines, Manila, July 13-15, 1999[C]. Bangkok, Thailand: SEAFDEC, 2000: 118-134. http://hdl.handle.net/20.500.12066/4348
[18] SIRIRAKSOPHON S, NAKAMURA Y, PRADIT S, et al. Ecological Aspects of Oceanic Squid, Sthenoteuthis oualaniensis (Lesson) in the South China Sea, Area III: Western Philippines: proceedings of the third Technical Seminar on Marine Fishery Resources Survey in the South China Sea, Area III: Western Philippines, Manila, July 13-15, 1999[C]. Bangkok, Thailand: SEAFDEC, 2000: 101-117. http://repository.seafdec.org/handle/20.500.12066/4347
[19] 刘必林, 陈新军, 田思泉, 等. 西南大西洋公海阿根廷滑柔鱼性成熟的初步研究[J]. 上海水产大学学报, 2008, 17(6): 721-725. doi: 10.3969/j.issn.1000-9957.2010.04.013 [20] WORMUTH J H. The biogeography and numerical taxonomy of the oegopsid squid family Ommastrephidae in the Pacific Ocean[C]//Bull Scripps Inst Oceanogr. California: University of California Press, 1976: 9-10. https://searchworks.stanford.edu/view/7634355
[21] STAAF D J, RUIZ-COOLEY R I, ELLIGER C, et al. Ommastrephid squids Sthenoteuthis oualaniensis and Dosidicus gigas in the eastern Pacific show convergent biogeographic breaks but contrasting population structures[J]. Mar Ecol Prog Ser, 2010, 418(11): 165-178. doi: 10.3354/meps08829
[22] 陈新军. 新西兰海域双柔鱼的生物学研究[J]. 中国水产科学, 1999, 6(1): 27-32. doi: 10.3321/j.issn:1005-8737.1999.01.007 -
期刊类型引用(26)
1. 温利红,张衡,方舟,陈新军. 鸢乌贼渔业资源研究进展. 水产科学. 2023(03): 527-537 .  百度学术
百度学术
2. 招春旭,吴文秀,邱星宇,周倍合,谢嘉仪,康斌,颜云榕. 南海不同海域鸢乌贼生长与死亡参数比较. 上海海洋大学学报. 2021(02): 294-300 . 百度学术
3. 谢嘉仪,张丽姿,吴文秀,周倍合,陈秋杰,招春旭,何雄波,徐军,颜云榕. 南沙群岛海域鸢乌贼摄食习性与营养生态位. 水产学报. 2021(12): 1993-2002 . 百度学术
4. 陈炫妤,陆化杰,王洪浩,何静茹,刘凯,陈新军. 西北印度洋鸢乌贼角质颚色素沉积特性分析. 动物学杂志. 2020(04): 468-476 . 百度学术
5. 朱凯,张立川,肖楚源,陈新军,林东明,朱俊磊. 南海鸢乌贼微型群雌性个体繁殖力研究. 渔业科学进展. 2020(06): 140-148 . 百度学术
6. 朱凯,姚吉祥,陈新军,刘维达,孙程婕,林东明. 南海鸢乌贼微型群肌肉和性腺组织能量积累及其分配. 上海海洋大学学报. 2020(06): 910-920 . 百度学术
7. 朱凯,王雪辉,杜飞雁,张鹏,邱永松. 南海中南部鸢乌贼中型群与微型群形态指标的分析比较. 中国海洋大学学报(自然科学版). 2019(01): 43-54 . 百度学术
8. 李敏,张鹏,张俊,张魁,陈作志. 南海鸢乌贼的遗传差异:种群分化还是种间分化. 中国水产科学. 2019(01): 133-140 . 百度学术
9. 朱凯,张立川,陈新军,姚吉祥,韩飞,林东明. 南海鸢乌贼中型群雄性个体肌肉和性腺组织能量积累及其分配. 热带海洋学报. 2019(04): 41-51 . 百度学术
10. 朱凯,张立川,陈新军,陆化杰,林东明,姚吉祥,马有成. 基于精荚数量对鸢乌贼中型群雄性个体有效繁殖力的研究. 动物学杂志. 2019(04): 517-528 . 百度学术
11. 黄佳兴,龚玉艳,徐姗楠,陈作志,张俊,于文明. 南海中西部海域鸢乌贼中型群和微型群的营养生态位. 应用生态学报. 2019(08): 2822-2828 . 百度学术
12. 刘玉,王雪辉,杜飞雁,刘必林,张鹏,刘梦娜,邱永松. 南海鸢乌贼耳石微量元素差异性分析. 南方水产科学. 2019(05): 15-24 . 本站查看
13. 朱凯,孙程婕,陈新军,林东明,刘海涛,古昊. 南海鸢乌贼中型群雌性个体肌肉和性腺组织能量积累及其分配. 海洋渔业. 2019(06): 641-651 . 百度学术
14. 刘玉,王雪辉,杜飞雁,刘必林,张鹏,刘梦娜,邱永松. 基于耳石微结构的南海鸢乌贼日龄和生长研究. 热带海洋学报. 2019(06): 62-73 . 百度学术
15. 龚玉艳,孔啸兰,杨玉滔,詹凤娉,张鹏,江艳娥,陈作志. 南海鸢乌贼微型群体的摄食习性研究. 海洋渔业. 2018(04): 394-403 . 百度学术
16. 徐亮,宁加佳,王雪辉,徐磊,刘玉,杜虹,杜飞雁. 脂类去除对南海鸢乌贼肌肉碳、氮稳定同位素分析的影响. 南方水产科学. 2018(04): 88-93 . 本站查看
17. 江淼,马胜伟,吴洽儿. 南海鸢乌贼资源探捕与开发. 中国渔业经济. 2018(02): 65-70 . 百度学术
18. 粟丽,陈作志,张鹏,李杰,王欢欢,黄佳兴. 2017年南海中南部渔场灯光罩网渔获物组成及渔获率时空分布. 南方水产科学. 2018(05): 11-20 . 本站查看
19. 王雪辉,邱永松,张鹏,杜飞雁. Natural mortality estimation and rational exploitation of purpleback flying squid Sthenoteuthis oualaniensis in the southern South China Sea. Chinese Journal of Oceanology and Limnology. 2017(04): 902-911 . 百度学术
20. 于鑫,单秀娟,李忠义,朱仁,陈云龙,金显仕. 渤海底拖网主要渔业生物类别时空分布的初步研究. 南方水产科学. 2017(02): 9-17 . 本站查看
21. 黄卉,杨丽芝,杨贤庆,李来好,郝淑贤,魏涯,王锦旭. 南海鸢乌贼墨汁多糖分离纯化及组分分析. 食品科学. 2017(24): 118-123 . 百度学术
22. 招春旭,陈昭澎,何雄波,邓玉淑,冯波,颜云榕. 基于耳石微结构的南海春季鸢乌贼日龄、生长与种群结构的研究. 水生生物学报. 2017(04): 884-890 . 百度学术
23. 朱凯,杜飞雁,王雪辉,邱永松,张鹏. 南海中南部鸢乌贼中型群群体结构. 应用生态学报. 2017(04): 1370-1376 . 百度学术
24. 粟丽,陈作志,张鹏. 南海中南部海域春秋季鸢乌贼繁殖生物学特征研究. 南方水产科学. 2016(04): 96-102 . 本站查看
25. 龚玉艳,詹凤娉,杨玉滔,张鹏,孔啸兰,江艳娥,陈作志. 南海鸢乌贼摄食习性的初步研究. 南方水产科学. 2016(04): 80-87 . 本站查看
26. 朱凯,王雪辉,张鹏,杜飞雁,邱永松. 南海南部鸢乌贼中型群与微型群形态学差异及其判别分析. 热带海洋学报. 2016(06): 82-88 . 百度学术
其他类型引用(8)
计量
- 文章访问数: 3052
- HTML全文浏览量: 170
- PDF下载量: 783
- 被引次数: 34
 粤公网安备 44010502001741号
