ZHANG Lirong, HAO Huimin, NIE Zhulan, WEI Jie, ZHANG Dieyan. Feeding habits of Triplophysa tenuis in Xinjiang based on fatty acid and stable carbon and nitrogen isotopic analysis[J]. South China Fisheries Science, 2024, 20(2): 92-101. DOI: 10.12131/20230187
Citation:
ZHANG Lirong, HAO Huimin, NIE Zhulan, WEI Jie, ZHANG Dieyan. Feeding habits of Triplophysa tenuis in Xinjiang based on fatty acid and stable carbon and nitrogen isotopic analysis[J]. South China Fisheries Science, 2024, 20(2): 92-101. DOI: 10.12131/20230187
ZHANG Lirong, HAO Huimin, NIE Zhulan, WEI Jie, ZHANG Dieyan. Feeding habits of Triplophysa tenuis in Xinjiang based on fatty acid and stable carbon and nitrogen isotopic analysis[J]. South China Fisheries Science, 2024, 20(2): 92-101. DOI: 10.12131/20230187
Citation:
ZHANG Lirong, HAO Huimin, NIE Zhulan, WEI Jie, ZHANG Dieyan. Feeding habits of Triplophysa tenuis in Xinjiang based on fatty acid and stable carbon and nitrogen isotopic analysis[J]. South China Fisheries Science, 2024, 20(2): 92-101. DOI: 10.12131/20230187
School of Life Science and Technology, Tarim University, Aral City 843300, China
2 .
State Key Laboratory Breeding Base for The Protection and Utilization of Biological Resources in Tarim Basin Co-funded by Xinjiang Corps and The Ministry of Science and Technology, Aral City 843300, China
3 .
Tarim Rare Fish Research Center, Aral City 843300, China
4 .
Agricultural Technology Extension Station of The First Division, Xinjiang Production & Construction, Aral City 843300, China
Triplophysa tenuis plays an important role in maintaining the flow of material and energy in aquatic ecosystem. In this study, we applied fatty acid biomarker method and carbon and nitrogen stable isotope technique to study the feeding and nutritional ecological niche characteristics of T. tenuis. The results show that a total of 22 fatty acids were detected in the muscle, including eight kinds of saturated fatty acids (SFA), six kinds of monounsaturated fatty acids (MUFA) and eight kinds of polyunsaturated fatty acids (PUFA). The specific fatty acid analysis reveals that T. tenuis feeds on zooplankton, diatoms, land plants, or fish and shrimps that like to feed on diatoms. The carbon stable isotope (δ13C) values and nitrogen stable isotope (δ15N) values ranged from −27.09‰ to −20.98‰ and from 5.71‰ to 8.45‰, while trophic levels ranged from 2.68 to 3.48. There were no significant differences between males and females (P>0.05) in δ13C value, δ15N value or trophic level. Males had higher standard ellipse area (SEAc) and total area of convex hull (TA) than females. There were significant changes in δ13C values with increasing body length (P<0.01), and insignificant changes in δ15N values and trophic level. The SEAc areas of 70−80 mm body length group did not overlap with those of greater than 90 mm body length group, and were categorized into different groups in the cluster analysis. In conclusion, T. tenuis is omnivorous and its food composition varies with body length As a predator with high trophic level, it can extend the food length chain length and increase the complexity of food web, which is conducive to the maintenance of stability of aquatic ecosystem.
Triplophysa tenuis, an endemic fish species in China, is distributed in the Tarim River, Aksu River, Kaidu River in Xinjiang, and the Heihe River and Shule River in the Hexi Corridor of Gansu Province [1]. It is characterized by a small body size and slow growth rate [2], along with strong adaptability to plateau environments, which contributes to the maintenance of ecological stability [3]. In recent years, native fish species in Xinjiang have faced threats from introduced species and human disturbances, leading to their endangered status [4]. Therefore, conservation of native fish species such as T. tenuis is urgently needed.
With increasing attention to the sustainable development of fish resources and biodiversity conservation, research on endangered fish conservation has deepened. Studying fish feeding habits not only helps understand the food composition and feeding environment of fish, revealing predatory competitive relationships between fish, further assessing fish activity patterns, and laying a foundation for fish biological research [5–7] but also reveals their important role in the entire aquatic ecosystem food chain, which is significant for protecting fish genetic resources [8]. Currently, research on T. tenuis is mostly focused on biology [9], growth characteristics [2], and artificial breeding [10], while research on feeding habits is relatively limited.
Traditional stomach content analysis is used for studying the feeding habits of most fish species, such as Mastacembelus armatus[11], Schizothorax macropogon[12], and T. crassilabris[13]. This method is intuitive and low-cost, but it can only reflect recent food intake of fish and cannot reflect the types of food already digested, which affects feeding determination results. In comparison, fatty acid markers and stable isotope analysis have obvious advantages in studying the long-term food intake of organisms. Specific fatty acids can usually only be synthesized by specific organisms. Exogenous fatty acids ingested by animals are stored in the food web transfer process, typically deposited in tissues, so fatty acid markers can be used to reveal long-term food sources and determine feeding relationships between organisms [14]. In ecological systems, carbon and nitrogen stable isotopes (δ13C and δ15N) can steadily accumulate in organisms through the food chain. Comparison of stable isotope ratios in organisms with corresponding isotope ratios in their food helps reveal the food sources and nutritional relationships of consumers over longer periods [15].
Therefore, this study used fatty acid marker method and stable isotope technology to explore the feeding habits and ecological niche of T. tenuis, analyzing changes in its main feeding sources and nutritional structure across sexes and body length groups and providing a scientific basis for investigating the impact of T. tenuis on the ecological system of its habitat waters.
1.
Materials and methods
1.1
Sample collection and processing
Samples used in the experiment were collected using traps from the Muzati River Basin in Xinjiang (80°59'9"E and 41°47'32"N) from April to May 2023. A total of 41 adult T. tenuis specimens were used, with their body length (measured to 0.01 mm accuracy) and body mass (measured to 0.01 g accuracy) measured and gender determined. After measurement, 20 female specimens had body lengths between 70.01 and 118.75 mm, body masses between 3.01 and 12.19 g, and intestine length/body length ratios between 0.57 and 0.98; 21 male specimens had body lengths between 70.06 and 112.26 mm, body masses between 2.80 and 10.70 g, and intestine length/body length ratios between 0.53 and 0.92. This study divided samples into five body length groups at 10 mm intervals. Dorsal muscle was taken from all 41 samples, rinsed with ultra-pure water, placed in a freeze dryer (TF-FD-1) at −54 ℃ for 48 h, ground into uniform powder, and stored in dry centrifuge tubes for later use.
1.2
Fatty acid determination
Approximately 50 mg of ground sample was weighed, and 1.0 mL of n-hexane (containing glyceryl triundecanoate as internal standard at a concentration of 0.5 mg·mL−1) was added, vortexed, and then heated in a 60 ℃ water bath for 30 min, occasionally mixing. After adding 1.0 mL of 0.5 mol·L−1 sodium methoxide solution for methylation, the mixture was thoroughly shaken for 10 min and centrifuged at 14 000 r·min−1 for 5 min, and the supernatant was filtered through a membrane for analysis. An Agilent 7000D mass spectrometer was used for fatty acid detection analysis. The injector temperature was 280 ℃; the ion source temperature was 230 ℃, with an electron impact ionization (EI) source used and ion monitoring (SIM) scanning mode selected, with an electron energy of 70 eV. Qualitative analysis was done by comparing with retention times of standard fatty acids, and quantification used the internal standard method.
1.3
Stable isotope analysis
1.3.1
Stable isotope calculation
All muscle samples stored in dry centrifuge tubes were sent to Shanghai Pisen Biotechnology Co., Ltd. for stable isotope determination. A Sercon Integra2 elemental analyzer-stable isotope ratio mass spectrometer (EA-IRMS) was used to measure the carbon and nitrogen stable isotope ratios of the samples. Carbon and nitrogen stable isotope analysis used international standard materials Pee Dee Belemnite (PDB) and standard atmospheric nitrogen for comparison, respectively. The formula[16] is
δX=(Rsample Rstandard −1)×103%
(1)
where δX is δ13C or δ15N (‰); Rsample is the isotope ratio of C or N detected in the sample, i.e., 13C/12C or 15N/14N; Rstandard is the 13C/12C abundance ratio of the international standard PDB or the 15N/14N abundance ratio of atmospheric nitrogen; analytical precision was δ13C < 0.1‰, δ15N < 0.2‰.
where TL is the sample's trophic level; δ15Nsample is the N stable isotope ratio of the sample; δ15Nbaseline is the nitrogen stable isotope ratio of baseline organisms in the aquatic ecosystem where the sample is located; δ15N is the enrichment of nitrogen stable isotopes between adjacent trophic levels; λ is the trophic level of the baseline organism. Baseline organisms usually refer to long-lived and perennial primary consumers with simple feeding habits [18]. This experiment lacked stable isotope measurements of plankton, so this study used the average Δδ15N value of zooplankton from the Kezile River, which is 3.4‰ [19], as the δ15Nbaseline; Δδ15N referenced the commonly used value in freshwater ecosystems (3.4‰) [17]; the baseline organism's λ value was 2.
1.3.3
Nutritional ecological niche parameters
Parameters used for nutritional ecological niche in this study include: 1) δ13C range (CR), the difference between the maximum and minimum δ13C values of T. tenuis, reflecting the diversity level of feeding sources; 2) δ15N range (NR), the difference between the maximum and minimum δ15N values of T. tenuis, reflecting the nutritional hierarchy of feeding [20]; 3) total area of convex hull (TA), the area of the convex polygon formed by the outermost two-dimensional point set of δ13C–δ15N, reflecting the species' ability to utilize resources; 4) standard ellipse area (SEAc), the area of the standard ellipse with all points in the δ13C–δ15N scatter plot as boundaries; SEAc is the corrected SEAc, which reduces the impact of sample size on results [21].
1.4
Data processing
SPSS 26.0 software was used for data processing, and one-way ANOVA was used for significance testing of gender and body length differences; Pearson analysis was used for the correlation between body length and fatty acids, body length, and δ13C and δ15N, and the SIBER package in R language was used for data calculation, including TA, SEA, SEAc, SEAc overlap rate, and SEAc overlap area.
2.
Results
2.1
Fatty acid composition and content
Fatty acid composition analysis of muscle tissue from 41 T. tenuis specimens detected 22 fatty acid components, with carbon chain lengths ranging from C11 to C22 (Table 1). These included eight saturated fatty acids (SFA) with a mass fraction of (76.68 ± 22.71) mg·g−1; six monounsaturated fatty acids (MUFA) with a mass fraction of (67.92 ± 24.07) mg·g−1; and eight polyunsaturated fatty acids (PUFA) with a mass fraction of (60.72 ± 18.73) mg·g−1. Among the 22 fatty acids, C16:1, C16:0, C20:5n3 (EPA), and C18:1n9 had relatively high content, accounting for 18.74%, 17.02%, 13.77%, and 13.40% of total fatty acid content, respectively. These four fatty acids accounted for over 50% of the total fatty acid content.
Table
1
Fatty acid composition and content of T. tenuis
The average mass fraction of n-3 series polyunsaturated fatty acids (n-3 PUFAs) was (46.72 ± 15.41) mg·g−1, and that of n-6 series fatty acids (n-6 PUFAs) was (13.99 ± 4.64) mg·g−1, accounting for 22.75% and 6.81% of total fatty acid content, respectively. The content of n-6 series fatty acids was significantly lower than that of n-3 series.
Regarding gender distribution, the average fatty acid mass fractions for female and male T. tenuis were (212.69 ± 63.77) and (198.32 ± 57.79) mg·g−1, respectively. SFA, MUFA, and PUFA content in female T. tenuis was all higher than in males. One-way ANOVA results showed no significant relationship between fatty acid content and gender in T. tenuis (F = 0.573 and P > 0.05).
2.2
Relationship between fatty acids and body length
Among body length groups (Table 2), SFA content was highest in the 70–80 mm body length group, reaching (101.15 ± 15.55) mg·g−1, and it gradually decreased with increasing body length. Pearson correlation analysis showed an extremely significant negative correlation with body length (P < 0.01); MUFA and PUFA showed no significant correlation with body length (P > 0.05), with MUFA content highest in the 70–80 mm body length group and PUFA content highest in the 100–110 mm body length group. The ratio of polyunsaturated fatty acids to saturated fatty acids (PUFA/SFA) showed an extremely significant positive correlation with body length (P < 0.01). The mass fractions of C22:6n3 (DHA) and C20:5n3 (EPA) reached their maximum values in the 100–110 mm and 70–80 mm body length groups, at (12.36 ± 2.95) and (36.39 ± 12.65) mg·g−1, respectively. The content of n-3 fatty acids was higher than that of n-6 in all body length groups; n-3/n-6 was lowest in the 100–110 mm body length group and highest in the 70–80 mm body length group, with no significant differences in n-3/n-6 between body length groups (P > 0.05). DHA/EPA showed a significant positive correlation across body length groups (P < 0.05).
Table
2
Fatty acid mass fraction of T. tenuis in different body length groups
2.3
Carbon and nitrogen stable isotope characteristics of T. tenuis
In the carbon and nitrogen stable isotope measurement results for T. tenuis, δ13C ranged from −27.09‰ to −20.98‰, with an average of (−24.75 ± 1.54)‰ and a δ13C range of 4.18‰; δ15N ranged from 5.71‰ to 8.45‰, with an average of (7.09 ± 0.63)‰ and a δ15N range of 2.74‰.
The average δ13C value for female samples was (−24.52 ± 1.13)‰, with a CR of 4.18‰; the average δ13C value for male samples was (−24.71 ± 0.77)‰, with a CR of 2.82‰ (Table 3); there was no significant difference in δ13C between female and male samples (P > 0.05). The average δ15N value for female samples was (7.13 ± 0.48)‰, with an NR of 2.27‰; the average δ15N value for male samples was (7.05 ± 0.73)‰, with an NR of 2.71‰ (Table 3); there was no significant difference in δ15N between female and male samples (P > 0.05).
Table
3
Basic information and isotopic signature values of T. tenuis
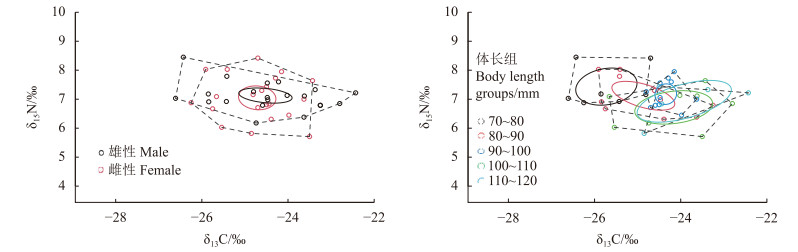
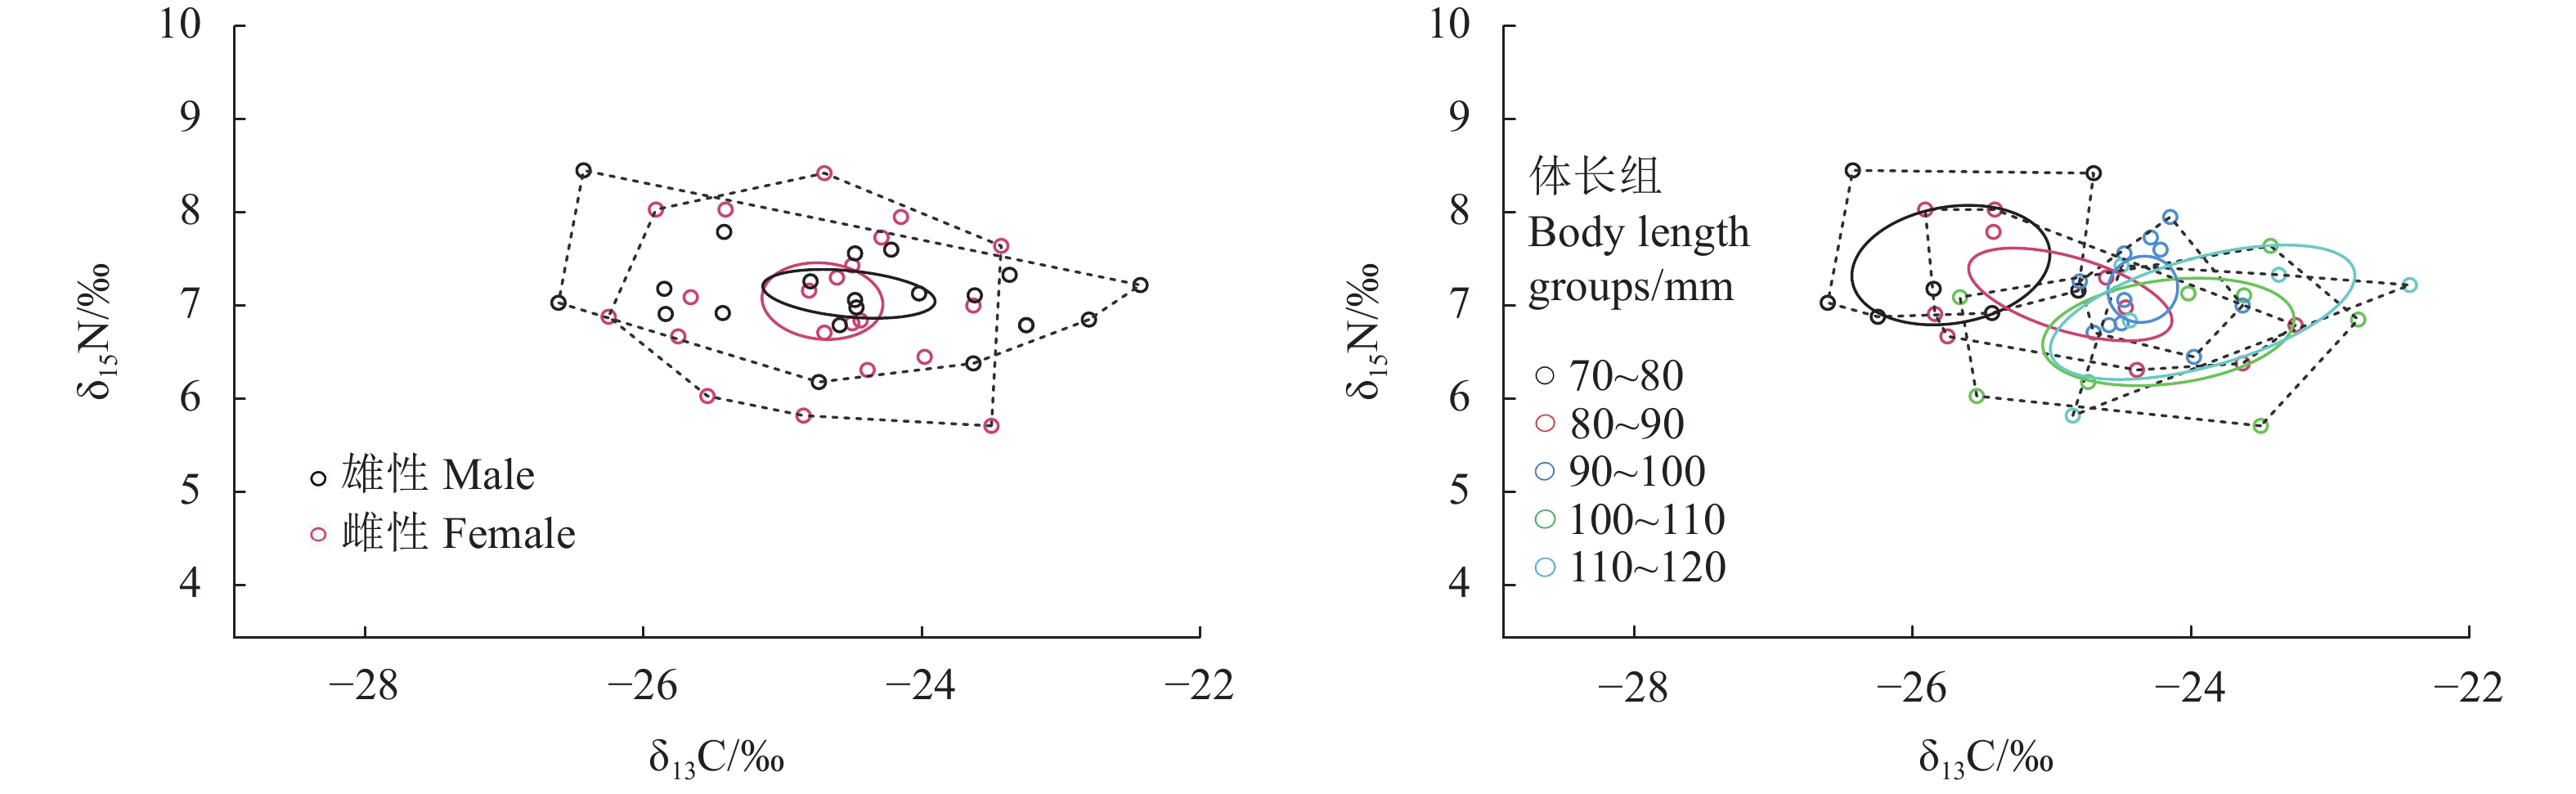
The trophic level of T. tenuis ranged from 2.68 to 3.48, with an average of 3.08 ± 0.18; female samples had trophic levels ranging from 2.81 to 3.48, with an average of 3.10 ± 0.14; male samples had trophic levels ranging from 2.68 to 3.47, with an average of 3.07 ± 0.22 (Table 3). There was no significant difference in trophic level between female and male samples (P > 0.05). Male samples had higher TA and SEAc values than female samples (Table 3 and Fig. 1). The SEAc overlap rate between female and male samples was 0.58, with an SEAc overlap area of 1.33‰2, accounting for 74.30% of the female samples and 67.86% of the male samples.
Fig.
1
TA and SEAc based on δ13C and δ15N values of T. tenuis
Note: The dotted lines represent TA, and the solid lines represent SEAc.
2.4
Distribution characteristics of carbon and nitrogen isotopes across body length in T. tenuis
Among the 41 muscle samples of T. tenuis, δ13C and δ15N showed maximum values in the 110–120 mm and 70–80 mm body length groups, respectively and minimum values in the 70–80 mm and 90–100 mm body length groups, respectively; CR and NR were both highest in the 90–100 mm body length group, while CR was lowest in the 80–90 mm body length group, and NR was lowest in the 100–110 mm body length group (Table 3).
TA and SEAc were both highest in the 90–100 mm body length group and lowest in the 100–110 mm body length group; the highest SEAc overlap rate (0.63) was between the 90–100 mm and 110–120 mm body length groups, with overlap areas accounting for 74.49% of the 90–100 mm body length group's SEAc area and 79.65% of the 110–120 mm body length group's SEAc area; the overlap area and overlap rate between the 70–80 mm and > 90 mm body length groups were both 0; cluster analysis results of δ13C and δ15N for different body length groups divided them into three groups: 70–80 mm, 80–90 mm, and > 90 mm (Tables 3–4, Figs. 1–2). Both results indicate that samples in the 70–80 mm body length group had less competition with samples in body length groups > 90 mm, possibly due to differences in feed selection, suggesting different feeding preferences, i.e., food composition varied with changes in body length.
Table
4
SEAc overlap area and overlap rate between body length groups
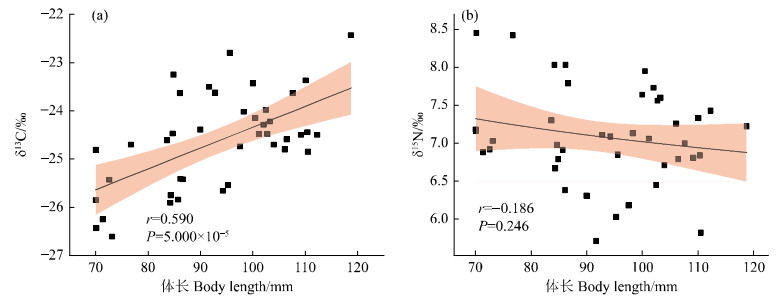
Trophic level was highest in the 70–80 mm body length group and lowest in the 90–100 mm body length group, but the differences did not reach significant levels (P > 0.05). Pearson correlation analysis of δ13C and δ15N in T. tenuis showed that δ13C significantly increased with body length (r = 0.590, P = 5.000 × 10⁻⁵, and Fig. 3-a); the correlation between δ15N and body length was not significant (r = −0.186, P = 0.246, Fig. 3-b).
Fig.
3
Correlation between δ13C, δ15N values, and body length of T. tenuis
3.1
Fatty acid composition and content of T. tenuis
Fatty acid composition and content are important indicators for evaluating the nutritional value and feeding characteristics of fish [22]. This study detected 22 fatty acids, with saturated fatty acids having the highest content, followed by monounsaturated fatty acids, and polyunsaturated fatty acids having the lowest content. Among saturated fatty acids, C16:0 was most abundant, accounting for 45.57% of saturated fatty acid content, consistent with research by Wu et al. [23] on Dali Lake loach and Zhao et al. [24] on spined loach (Cobitis taenia Linnaeus). C16:0 is one of the first fatty acids synthesized in fatty acid synthesis. Therefore, its content is relatively high among saturated fatty acids [25]. Among monounsaturated fatty acids in T. tenuis, C16:1 and C18:1n9c were highest in content, accounting for 97.13% of monounsaturated fatty acid content. Monounsaturated fatty acids have certain effects in regulating blood glucose and blood lipids [26]. Among polyunsaturated fatty acids, DHA and EPA have the highest content and are essential fatty acids for fish, participating in gene expression regulation, cell membrane construction, cell proliferation, and metabolism of some growth hormones during the basic growth process of organisms [27].
3.2
Analysis of T. tenuis feeding habits based on characteristic fatty acids
Based on traditional stomach content anatomical observations, T. tenuis feeds on animal feed, mainly benthic animals such as midge larvae and aquatic insect larvae [28]. Characteristic fatty acids can indicate individual feeding habits, and the content and composition of fatty acids can better reflect the food source situation of individuals [29] (Table 5).
Table
5
Characteristic fatty acid and indicative food behavior
C15:0 and C17:0 are characteristic fatty acids indicating planktonic bacteria, showing the predator's feeding on planktonic bacteria [30]. This study found small amounts of C15:0 and C17:0 in the fatty acids of T. tenuis muscle, accounting for 0.45% of total fatty acids, indicating that planktonic bacteria contribute extremely little to the energy source of T. tenuis.
C18:2n6 + C18:3n3 greater than 2.5% is usually used as a marker for terrestrial plants [31]. In this study, C18:2n6 + C18:3n3 = 8.98% > 2.5% in T. tenuis muscle tissue, indicating that terrestrial plants contribute to its food composition. C20:1 and C22:1 can serve as marker fatty acids for predators feeding on herbivorous copepods, as C20:1 and C22:1, being long-chain fatty acids, can only be synthesized by herbivorous copepods [32]. In this study, C20:1 and C22:1 accounted for only 0.59% of fatty acid content, indicating that herbivorous copepods contribute very little to the food composition of T. tenuis. C20:4n6 (ARA) is commonly used as a characteristic fatty acid indicating large benthic organisms [33] and can indicate the feeding of microzooplankton on large algal detritus, as well as the transfer of large algal detritus through the saprophytic food chain to carnivorous animals at higher trophic levels [34]. The C20:4n6 content in T. tenuis muscle was only 0.64%, indicating that benthic organisms contribute minimally to its food composition. C18:0 can be converted to C18:1n9, and C18:1n9 can be used as a marker fatty acid indicating carnivorous organisms [35], and can also serve as a characteristic fatty acid indicating higher carnivorous organisms feeding on zooplankton [36]. The C18:1n9 content in T. tenuis muscle was 13.40%, indicating that zooplankton contribute significantly to the food source of T. tenuis, and its intestine length to body length ratio was less than 1, confirming its carnivorous nature. Dinoflagellates can synthesize more DHA, and EPA/DHA less than 1 can be used to indicate that fish food sources contain dinoflagellates [37]. In this study, the mass fraction of DHA was 5.24%, with no correlation with body length, and EPA/DHA = 2.63 > 1; therefore, dinoflagellates contribute extremely little to the food source of T. tenuis.
C14:0 and C16:0 had relatively high content in T. tenuis muscle, accounting for 22.21% of total fatty acid content. C14:0 and C16:0 can indicate the predator's feeding on diatoms, but since C16:0 is a fatty acid generally present in organisms and can be synthesized by the organism itself, using it to indicate information about the prey is relatively difficult[38]. C16:1 and EPA cannot be synthesized by organisms themselves and can be used as characteristic fatty acids indicating diatoms [39–40]. Diatoms are preferred food for many zooplankton, fish, and shrimp, and EPA can indicate dinoflagellates [37]. In this study, C16:1 accounted for 18.74% of total fatty acid content, indicating that T. tenuis feeds on diatoms; the C18:1n9 content indicating zooplankton was 13.40%, combined with high-throughput sequencing results [19], it is inferred that the higher diatom content in T. tenuis muscle might be due to feeding on zooplankton and fish/shrimp that prefer diatoms.
PUFA/SFA and DHA/EPA can be used to indicate the size of an organism's trophic level, with higher values indicating higher trophic levels [41]. PUFA/SFA and DHA/EPA in T. tenuis showed significant positive correlations with body length, with trophic level increasing with body length. However, in this study, overall PUFA/SFA and DHA/EPA were relatively small, indicating that changes in trophic position are not large. Fukuda and Naganuma [34] suggested that Σn-6/Σn-3 can be used to estimate the contribution ratio of saprophytic food chains to predatory food chains for high trophic level predators. In this study, Σn-6/Σn-3 was low, indicating that the contribution rate of saprophytic food chains to T. tenuis feeding is low.
3.3
Carbon and nitrogen stable isotope analysis
3.3.1
Stable isotope differences between female and male samples
This study showed no significant differences in δ13C and δ15N between female and male muscle samples of T. tenuis (P > 0.05), indicating similar food sources and trophic levels. Female samples had higher δ13C and δ15N than male samples, consistent with research by Wang et al. [42] on Decapterus maruadsi, suggesting that female individuals need to consume higher trophic level prey organisms to meet individual ovarian development and reproductive requirements [43]. CR is used to reflect the breadth of consumer food sources, while NR is used to reflect nutritional length [20]. The CR of female samples (4.18‰) was significantly higher than that of male samples (2.82‰), indicating that females feed on a wider range of prey; the NR of female samples (2.27‰) was smaller than that of male samples (2.71‰), indicating that males feed across a longer nutritional length with higher nutritional levels. Ecological niche width is typically used to describe the degree of specialization in a species' resource and environmental requirements, predicting adaptability to changing environmental conditions [44]. In this experiment, male samples had higher TA (5.76‰2) and SEAc (1.96‰2) than female samples [TA (5.31‰2) and SEAc (1.79‰2)], indicating that male samples have larger activity space, higher resource utilization, and stronger ability to adapt to environmental changes. SEAc overlap rate is used to reflect the similarity of species' feeding prey, with higher overlap indicating more intense competition for food [45]. The high SEAc overlap area (1.33‰2) and overlap rate (0.58) between female and male samples indicate that they are basically consistent in prey selection and exhibit some competition during intraspecific feeding.
3.3.2
Stable isotope analysis across different body lengths
Pearson correlation analysis of body length and δ13C in T. tenuis showed that δ13C increases with body length, indicating that T. tenuis feeds on prey with higher δ13C as body length increases; CR showed fluctuations across body length groups, with irregular changes in the diversity of food sources. The inferred reasons are: 1) When T. tenuis has a smaller body size, intraspecific and interspecific competition for food resources exists, leading to weakened food sources. As they grow and feeding organs fully develop, larger individuals have stronger predatory ability, enhanced competitive ability, and increased food resource diversity; 2) Changes in habitat environment affect the diversity of food sources to some extent.
Generally, as individuals grow, the δ15N in predators continuously accumulates, and the trophic level rises accordingly [46]. Zhang and Liu [47] found in their study of the nutritional ecological niche of Enoploteuthis chunii that δ15N increases with mantle length. However, in this study, the correlation between body length and δ15N was not significant, and δ15N actually showed a decreasing trend with increasing body length. The inferred reasons are: 1) As body size increases, T. tenuis may feed on larger prey with lower trophic levels. Research has found that T. tenuis mainly feeds on fish of the genus Schizothorax, which are larger but have lower trophic levels than T. tenuis[19]; 2) The sampling point is located in the middle and upper reaches of the Muzati River, where water temperature is low; elevation is high, and invasive fish species are few. Native fish species of the genera Schizothorax and Triplophysa remain dominant [48]. Therefore, there are fewer predators at high trophic levels, and the overall trophic layer is low. As a predator with relatively high trophic level in this water area, T. tenuis fully utilizes the fish biological resources in the basin, not only extending the food chain length of the ecosystem but also increasing the complexity of the food web in the basin, which is conducive to maintaining the stability of the entire river ecosystem.
For body lengths greater than 100 mm, SEAc showed a declining trend, with the highest value in the 90–100 mm body length group, indicating that T. tenuis in this body length group has the highest resource utilization rate, while in the 100–110 mm body length group, SEAc was lowest, indicating the lowest resource utilization rate. There was no overlap in SEAc between the 70–80 mm and > 90 mm body length groups, and cluster analysis results showed that T. tenuis in the 70–80 mm group and > 90 mm groups were quite distant and could be divided into different groups. Due to the lack of research data on the types and quantities of prey consumed by T. tenuis, and given that changes in fish food composition with body length are a common phenomenon [49], it is inferred that the food composition of T. tenuis varies with body length. As individual body length gradually increases, swimming ability strengthens; feeding range expands, and resource utilization efficiency improves accordingly. Larger individuals show stronger competitive ability, with higher success rates in preying on larger prey organisms [50].
3.3.3
Trophic level and feeding habits of T. tenuis
The study found that the trophic level of T. tenuis ranged from 2.68 to 3.48, with an average of 3.08 ± 0.18. Zhao et al. [19] determined through stable isotope analysis that the trophic level of T. tenuis in the Kezile River was 3.55, showing some difference from this study, mainly due to different research areas. Stable isotopes in organisms are greatly influenced by fractionation mechanisms, with different stable isotopes in the same tissue showing different enrichment degrees [51]. Between primary producers and consumers, consumers basically retain the δ13C characteristics of their food, so δ13C can be used for fish food composition analysis [52]. Boutton [53] considered that terrestrial C3 plants have δ13C between −30‰ and −23‰ and δ15N between −5‰ and 18‰; terrestrial C4 plants have δ13C between −17‰ and −9‰ and δ15N between 3‰ and 6‰; estuarine phytoplankton have δ13C between −30‰ and −19‰ and δ15N between 6‰ and 9‰ [54]. In this study, T. tenuis had δ13C of (−24.62 ± 0.97)‰, which falls between terrestrial C3 plants and estuarine phytoplankton, but it is closer to terrestrial C3 plants, indicating that T. tenuis feeds more on terrestrial C3 plants. This result is similar to the food source results from high-throughput sequencing of the intestinal food sources [19], showing that T. tenuis will consume some plants of the genera Aztecaster, Tamarix, and citrus plants; fatty acid determination results also verified that its muscle contains some fatty acids indicating terrestrial plants.
When the feeding habits of T. tenuis using characteristic fatty acids are explored, the same characteristic fatty acid marker can indicate multiple types of food, lacking accuracy, and it cannot determine whether some food is directly or indirectly consumed by T. tenuis; the feeding of fish changes with body length, which is a common phenomenon. This study used stable isotope technology to infer that the food composition of T. tenuis also changes with body length. The above conclusions are all based on biomarker methods, so the authors believe that to make the results more convincing, traditional stomach content analysis methods should be combined in the future to gain a detailed understanding of the types and quantities of prey consumed by T. tenuis and the changes in food composition at various growth stages, making the experimental results more comprehensive and accurate.
4.
Conclusion
This study analyzed the feeding habits of T. tenuis based on the fatty acid biomarker method and carbon and nitrogen stable isotope technology, discussing the content and relationship between fatty acid composition and carbon and nitrogen stable isotopes in female and male individuals and across different body length groups. Characteristic fatty acid indicators showed that T. tenuis feeds on zooplankton, diatoms, terrestrial plants, or fish and shrimp that prefer to feed on diatoms, classifying it as an omnivorous fish. Carbon and nitrogen stable isotope analysis results showed little difference in stable isotopes between female and male samples; based on nutritional ecological niche width indicators and cluster analysis, it is inferred that the food composition of T. tenuis varies with body length. However, this study lacks research on the feeding species and quantities of T. tenuis, and in the future, it should be combined with traditional stomach content microscopy to study the feeding habits of T. tenuis at various growth stages, further improving the accuracy of results.
MOTTA P J, CLIFTON K B, HERNANDEZ P, et al. Ecomorphological correlates in ten species of subtropical seagrass fishes: diet and microhabitat utilization[J]. Environ Biol Fish, 1995, 44(1): 37-60.
[6]
PIET G J. Ecomorphology of a size-structured tropical freshwater fish community[J]. Environ Biol Fish, 1998, 51(1): 67-86. doi: 10.1023/A:1007338532482
[7]
HYSLOP E J. Stomach contents analysis:a review of methods and their application[J]. J Fish Biol, 1980, 17(4): 411-429. doi: 10.1111/j.1095-8649.1980.tb02775.x
[8]
XIA Y G, LI Y F, ZHU S Z, et al. Individual dietary specialization reduces intraspecific competition, rather than feeding activity, in black Amur bream (Megalobrama terminalis)[J]. Sci Rep, 2020, 10(1): 17961. doi: 10.1038/s41598-020-74997-8
BECKMANN C L, MITCHELL J G, STONE D A J, et al. A controlled feeding experiment investigating the effects of a dietary switch on muscle and liver fatty acid profiles in Port Jackson sharks Heterodontus portusjacksoni[J]. J Exp Mar Biol Ecol, 2013, 448: 10-18. doi: 10.1016/j.jembe.2013.06.009
LAYMAN C A, ARRINGTON D A, MONTAÑA C G, et al. Can stable isotope ratios provide for community-wide measures of trophic structure?[J]. Ecology, 2007, 88(1): 42-48. doi: 10.1890/0012-9658(2007)88[42:CSIRPF]2.0.CO;2
[21]
JACKSON A L, INGER R, PARNELL A C, et al. Comparing isotopic niche widths among and within communities: SIBER-Stable iotope bayesian ellipses in R[J]. J Anim Ecol, 2011, 80(3): 595-602. doi: 10.1111/j.1365-2656.2011.01806.x
[22]
SARGENT J R, TOCHER D R, BELL J G. The lipids[J]. Fish Nutr, 2003: 181-257.
RAJENDRAN N, SUWA Y, URUSHIGAWA Y. Distribution of phospholipid ester-linked fatty acid biomarkers for bacteria in the sediment of Ise Bay, Japan[J]. Mar Chem, 1993, 42(1): 39-56. doi: 10.1016/0304-4203(93)90248-M
[31]
EVERY S L, PETHYBRIDGE H R, CROOK D A, et al. Comparison of fin and muscle tissues for analysis of signature fatty acids in tropical euryhaline sharks[J]. J Exp Mar Biol Ecol, 2016, 479: 46-53. doi: 10.1016/j.jembe.2016.02.011
[32]
FALK-PETERSEN S, SARGENT J R, TANDE K S. Lipid composition of zooplankton in relation to the sub-arctic food web[J]. Polar Biol, 1987, 8(2): 115-120. doi: 10.1007/BF00297065
[33]
STOWASSER G, POND D W, COLLINS M A. Using fatty acid analysis to elucidate the feeding habits of Southern Ocean mesopelagic fish[J]. Mar Biol, 2009, 156: 2289-2302. doi: 10.1007/s00227-009-1256-4
[34]
FUKUDA Y, NAGANUMA T. Potential dietary effects on the fatty acid composition of the common jellyfish Aurelia aurita[J]. Mar Biol, 2001, 138(5): 1029-1035. doi: 10.1007/s002270000512
JOHNS R B, NICHOLS P D, PERRY G J. Fatty acid composition of ten marine algae from Australian waters[J]. Phytochemistry, 1979, 18(5): 799-802. doi: 10.1016/0031-9422(79)80018-7
[37]
PARRISH C C, ABRAJANO T A, BUDGE S M, et al. Lipid and phenolic biomarkers in marine ecosystems: analysis and applications[J]. Mar chem, 2000: 193-223.
VISO A C, MARTY J C. Fatty acids from 28 marine microalgae[J]. Phytochemistry, 1993, 34(6): 1521-1533. doi: 10.1016/S0031-9422(00)90839-2
[40]
POND D W, BELL M V, HARRIS R P, et al. Microplanktonic polyunsaturated fatty acid markers: a mesocosm trial[J]. Estuar Coast Shelf S, 1998, 46(2): 61-67. doi: 10.1006/ecss.1998.0334
[41]
ROSSI S, YOUNGBLUTH M J, JACOBY C A, et al. Fatty acid trophic markers and trophic links among seston, crustacean zooplankton and the siphonophore Nanomia cara in Georges Basin and Oceanographer Canyon[J]. Sci Mar, 2008, 72(2): 403-416.
LIU B L, XU W, CHEN X J, et al. Ontogenetic shifts in trophic geography of jumbo squid, Dosidicus gigas, inferred from stable isotopes in eye lens[J]. Fish Res, 2020, 226: 105507. doi: 10.1016/j.fishres.2020.105507
[44]
HURLBERT S H. The measurement of niche overlap and some relatives[J]. Ecology, 1978, 59(1): 67-77. doi: 10.2307/1936632
HOBSON K A, SINCLAIR E H, YORK A E, et al. Retrospective isotopic analyses of Steller sea lion tooth annuli and seabird feathers: a cross-taxa approach to investigating regime and dietary shifts in the Gulf of Alaska[J]. Mar Mammal Sci, 2004, 20(3): 621-638. doi: 10.1111/j.1748-7692.2004.tb01183.x
HORINOUCHI M, SANO M. Food habits of fishes in a Zostera marina bed at aburatsubo, central japan[J]. Ichthyol Res, 2000, 47(2): 163-173. doi: 10.1007/BF02684237
[51]
BUDGE S M, IVERSON S J, KOOPMAN H N. Studying trophic ecology in marine ecosystems using fatty acids: a primer on analysis and interpretation[J]. Mar Mammal Sci, 2006, 22(4): 759-801. doi: 10.1111/j.1748-7692.2006.00079.x
[52]
KRITZBERG E S, COLE J J, PACE M L, et al. Autochthonous versus allochthonous carbon sources of bacteria: results from whole-lake 13C addition experiments[J]. Limnol Oceanogr, 2004, 49(2): 588-596. doi: 10.4319/lo.2004.49.2.0588
[53]
BOUTTON T W. Stable carbon isotope ratios of natural materials: II. Atmospheric, terrestrial, marine, and freshwater environments[J]. Carbon Isot Tech, 1991(1): 173-185.
[54]
BOUILLON S, MOHAN P C, SREENIVAS N, et al. Sources of suspended organic matter and selective feeding by zooplankton in an estuarine mangrove ecosystem as traced by stable isotopes[J]. Mar Ecol Prog Ser, 2000, 208(1): 79-92.
[1]
GUO Y, ZHANG R M, CAI L G. Ichthyofauna of Xinjiang [M]. Urumqi: Xinjiang Science and Technology Press, 2012: 114–115. (in Chinese)
[2]
JIN S S, WANG X Y, LIN X, et al. Relationship between age and growth of Triplophysa tenuis in Kaidu River in Xinjiang [J]. Xinjiang Agricultural Sciences, 2020, 57(1): 181–189. (in Chinese)
[3]
ZENG L, TANG W Q. Discussion on Age Determination Methods for Two Esquamate Triplophysa Fishes [J]. Chinese Journal of Zoology., 2010, 45(1): 94–103. (in Chinese)
[4]
MA Y W, GUO Y, CHEN P, et al. Fauna composition and distribution of fish in the Kaidu River of Xinjiang Uygur Autonmous Region [J]. Freshwater Fisheries, 2013, 43(5): 21–26. (in Chinese)
[5]
MOTTA P J, CLIFTON K B, HERNANDEZ P, et al. Ecomorphological correlates in ten species of subtropical seagrass fishes: diet and microhabitat utilization [J]. Environ Biol Fish, 1995, 44(1): 37–60.
[6]
PIET G J. Ecomorphology of a size-structured tropical freshwater fish community [J]. Environ Biol Fish, 1998, 51(1): 67–86.
[7]
HYSLOP E J. Stomach contents analysis: a review of methods and their application [J]. J Fish Biol, 1980, 17(4): 411–429.
[8]
XIA Y G, LI Y F, ZHU S Z, et al. Individual dietary specialization reduces intraspecific competition, rather than feeding activity, in black amur bream (Megalobrama terminalis) [J]. Sci Rep, 2020, 10(1): 17961.
[9]
YAO N, LIU J Y, MA L, et al. Biological characteristics of Triplophysa bombifrons and Triplophysa tenuis in the upper reaches of Tarim River [J]. Guizhou Agricultural Sciences, 2018, 46(4): 82–86. (in Chinese)
[10]
XIE C G, ZHOU Z G, ABUDUWUFU·YITI, et al. Preliminary study on artificial reproduction of Triplophysa tenuis, a typical fish in Pamir Plateau [J]. China Fisheries, 2018(7): 100–101. (in Chinese)
[11]
MA B H, WANG H H, XU X D, et al. Research on structure of digestive tract and feeding habits in Mastacembelus armatus [J]. Progress in Fishery Sciences, 2022, 43(3): 56–63. (in Chinese)
[12]
LIU J Y. Study on biology and population dynamics of Schizothorax macropogon in the Yarlung Tsangpo River [D]. Alar: Tarim University, 2016: 33. (in Chinese)
[13]
YAN S L, GUO Y S, YANG J, et al. Biology of Triplophysacrassilabris [J]. Fisheries Science, 2015, 34(8): 506–509. (in Chinese)
[14]
BECKMANN C L, MITCHELL J G, STONE D A J, et al. A controlled feeding experiment investigating the effects of a dietary switch on muscle and liver fatty acid profiles in Port Jackson sharks Heterodontus portusjacksoni [J]. J Exp Mar Biol Ecol, 2013, 448: 10–18.
[15]
CUI Y. Study on the carbon flow within the estuarine ecosystem in China based on stable isotopes and fatty acid composition [D]. Shanghai: East China Normal University, 2012: 17–26. (in Chinese)
[16]
PETERSON B J, FRY B. Stable isotopes in ecosystem studies [J]. Annu Rev Ecol Evol S, 1987, 18(1): 293–320.
[17]
POST D M. Using stable isotopes to estimate trophic position: models, methods, and assumptions [J]. Ecology, 2002, 83(3): 703–718.
[18]
VANDER ZANDEN M J, RASMUSSEN J B. Primary consumer δ13C and δ15N and the trophic position of aquatic consumers [J]. Ecology, 1999: 1395–1404.
[19]
ZHAO H, ZHAO N H, LI L, et al. Analysis of the diet of 5 indigenous fishes in Kizil River, Xinjiang [J]. Journal of Fishery Sciences of China, 2022, 29(10): 1461–1474. (in Chinese)
[20]
LAYMAN C A, ARRINGTON D A, MONTAÑA C G, et al. Can stable isotope ratios provide for community-wide measures of trophic structure? [J]. Ecology, 2007, 88(1): 42–48.
[21]
JACKSON A L, INGER R, PARNELL A C, et al. Comparing isotopic niche widths among and within communities: SIBER-Stable iotope bayesian ellipses in R [J]. J Anim Ecol, 2011, 80(3): 595–602.
[22]
SARGENT J R, TOCHER D R, BELL J G. The lipids [J]. Fish Nutr, 2003: 181–257.
[23]
WU P F, GENG L W, JIANG H F, et al. Analysis and evaluation of nutritional components in muscle of plateau fish Triplophysadalaica [J]. Chinese Journal of Fisheries, 2017, 30(1): 19–25. (in Chinese)
[24]
ZHAO Y L, GUO Z X, YIN Z B, et al. Comparative and analysis of nutritional value of wild and farmed Cobitis taenis [J]. Heilongjiang Animal Science and Veterinary Medicine, 2021(20): 132–136. (in Chinese)
[25]
QUAN S Y, LI Z, LIANG H W, et al. The change of nutrition and fatty acid in liver and ovary during the late ovarian development period of Changfeng silver carp [J]. Freshwater Fisheries, 2018, 48(5): 79–85. (in Chinese)
[26]
CAI S W, HAN T, HAN Y Q, et al. Effect of enteral nutrition containing slow-release starch and high-monounsaturated-fat on blood glucose and lipid metabolism in overweight type 2 diabete mellitus [J]. Parenteral & Enteral Nutrition, 2014, 21(3): 138–141. (in Chinese)
[27]
LEE R F, HAGEN W, KATTNER G. Lipid storage in marine zooplankton [J]. Mar Ecol Prog Ser, 2006, 307: 273–306.
[28]
TURSUN, REN B, ZHANG R M, et al. The study on the biology of Triplophysa (Triplophysa) teunis (Day) in Akesu River [J]. Chinese Journal of Fisheries, 2005(2): 65–69, 100 (in Chinese)
[29]
ZHAO Z F, HU G Y, CHEN X J, et al. Studies on monthly difference of fatty acid composition and dietary indicator of Dosidicus gigas in offshore waters of Peru [J]. Transactions of Oceanology and Limnology, 2022, 44(4): 98–105. (in Chinese)
[30]
RAJENDRAN N, SUWA Y, URUSHIGAWA Y. Distribution of phospholipid ester-linked fatty acid biomarkers for bacteria in the sediment of Ise Bay, Japan [J]. Mar Chem, 1993, 42(1): 39–56.
[31]
EVERY S L, PETHYBRIDGE H R, CROOK D A, et al. Comparison of fin and muscle tissues for analysis of signature fatty acids in tropical euryhaline sharks [J]. J Exp Mar Biol Ecol, 2016, 479: 46–53.
[32]
FALK-PETERSEN S, SARGENT J R, TANDE K S. Lipid composition of zooplankton in relation to the sub-arctic food web [J]. Polar Biol, 1987, 8(2): 115–120.
[33]
STOWASSER G, POND D W, COLLINS M A. Using fatty acid analysis to elucidate the feeding habits of Southern Ocean mesopelagic fish [J]. Mar Biol, 2009, 156: 2289–2302.
[34]
FUKUDA Y, NAGANUMA T. Potential dietary effects on the fatty acid composition of the common jellyfish Aurelia aurita [J]. Mar Biol, 2001, 138(5): 1029–1035.
[35]
LI L, ZHANG S, WU L Z. Fatty acid composition and feeding habits of ridgetail white prawn Exopalaemon carinicauda with different body length [J]. Journal of Dalian Ocean University, 2019, 34(4): 552–557. (in Chinese)
[36]
JOHNS R B, NICHOLS P D, PERRY G J. Fatty acid composition of ten marine algae from Australian waters [J]. Phytochemistry, 1979, 18(5): 799–802.
[37]
PARRISH C C, ABRAJANO T A, BUDGE S M, et al. Lipid and phenolic biomarkers in marine ecosystems: analysis and applications [J]. Mar Chem, 2000: 193–223.
[38]
LI H F, ZHOU H Q. Comparative studies on fatty acid composition of marine microalgae [J]. Oceanologia Et Limnologia Sinica, 1999, 30(1): 34–40. (in Chinese)
[39]
VISO A C, MARTY J C. Fatty acids from 28 marine microalgae [J]. Phytochemistry, 1993, 34(6): 1521–1533.
[40]
POND D W, BELL M V, HARRIS R P, et al. Microplanktonic polyunsaturated fatty acid markers: a mesocosm trial [J]. Estuar Coast Shelf S, 1998, 46(2): 61–67.
[41]
ROSSI S, YOUNGBLUTH M J, JACOBY C A, et al. Fatty acid trophic markers and trophic links among seston, crustacean zooplankton and the siphonophore Nanomia cara in Georges Basin and Oceanographer Canyon [J]. Sci Mar, 2008, 72(2): 403–416.
[42]
WANG K L, GONG Y Y, CHEN Z Z, et al. Trophic niche of Decapterus maruadsi in the northern South China Sea as revealed by stable isotope techniques [J]. Chinese Journal of Ecology, 2022, 41(4): 724–731. (in Chinese)
[43]
LIU B L, XU W, CHEN X J, et al. Ontogenetic shifts in trophic geography of jumbo squid, Dosidicus gigas, inferred from stable isotopes in eye lens [J]. Fish Res, 2020, 226: 105507.
[44]
HURLBERT S H. The measurement of niche overlap and some relatives [J]. Ecology, 1978, 59(1): 67–77.
[45]
WANG F, JU R T, LI Y Z, et al. Niche concept and its application in insect ecology [J]. Chinese Journal of Ecology, 2006(10): 1280–1284. (in Chinese)
[46]
HOBSON K A, SINCLAIR E H, YORK A E, et al. Retrospective isotopic analyses of Steller sea lion tooth annuli and seabird feathers: a cross-taxa approach to investigating regime and dietary shifts in the Gulf of Alaska [J]. Mar Mammal Sci, 2004, 20(3): 621–638.
[47]
ZHANG J Q, LIU B L. Comparative analysis of ecological niche of Enoploteuthis chunii and Abralia similis in the Northwest Pacific Ocean [J]. Journal of Dalian Ocean University, 2023, 38(3): 515–523. (in Chinese)
[48]
HAN J J, CHEN P, QI F, et al. Situations of fish stocks in Weigan River in Xinjiang [J]. Fisheries Science, 2022, 41(1): 92–101. (in Chinese)
[49]
XU L L, XUE Y, XU B D, et al. Feeding ecology of Hexagrammos otakii in Haizhou Bay [J]. Journal of Fishery Sciences of China, 2018, 25(3): 608–620. (in Chinese)
[50]
HORINOUCHI M, SANO M. Food habits of fishes in a Zostera marina bed at Aburatsubo, central Japan [J]. Ichthyol Res, 2000, 47(2): 163–173.
[51]
BUDGE S M, IVERSON S J, KOOPMAN H N. Studying trophic ecology in marine ecosystems using fatty acids: a primer on analysis and interpretation [J]. Mar Mammal Sci, 2006, 22(4): 759–801.
[52]
KRITZBERG E S, COLE J J, PACE M L, et al. Autochthonous versus allochthonous carbon sources of bacteria: results from whole-lake 13C addition experiments [J]. Limnol Oceanogr, 2004, 49(2): 588–596.
[53]
BOUTTON T W. Stable carbon isotope ratios of natural materials: Ⅱ. Atmospheric, terrestrial, marine, and freshwater environments [J]. Carbon Isot Tech, 1991(1): 173–185.
[54]
BOUILLON S, MOHAN P C, SREENIVAS N, et al. Sources of suspended organic matter and selective feeding by zooplankton in an estuarine mangrove ecosystem as traced by stable isotopes [J]. Mar Ecol Prog Ser, 2000, 208(1): 79–92.
Ameliorative effect of oyster enzymatic products on glucocorticoid-induced osteoporosis in rats
MA Wenyu et al., SOUTH CHINA FISHERIES SCIENCE, 2025
Alternation of gastric emptying, feeding behavior and digestive enzyme activities inhexagrammos otakii
WANG Feng et al., SOUTH CHINA FISHERIES SCIENCE, 2024
Chromosome-level genome and characteristic analysis ofplatax teira
OUYANG Yan et al., SOUTH CHINA FISHERIES SCIENCE, 2024
Investigation on behavioral preferences oflutjanus erythropterusjuvenile towards artificial reef models with different pore shapes and sizes
JIANG Manju et al., SOUTH CHINA FISHERIES SCIENCE, 2024
Feeding ecology ofsepia esculentain jiangsu coastal waters based on stable isotopes analysis
ZHOU Minhua et al., JOURNAL OF SHANGHAI OCEAN UNIVERSITY, 2024
Trophic niche of coilia brachygnathus in sanjiao lake based on stable carbon and nitrogen isotope analysis
JOURNAL OF HYDROECOLOGY, 2025
The chemistry behind the folin-ciocalteu method for the estimation of (poly)phenol content in food: total phenolic intake in a mediterranean dietary pattern
Perez, Maria et al., JOURNAL OF AGRICULTURAL AND FOOD CHEMISTRY, 2023
Assessment and treatment of avoidant/restrictive food intake disorder
Kambanis, P. Evelyna et al., CURRENT PSYCHIATRY REPORTS, 2023
Assessment of aquifer suitability for artificial recharge: the case of the ziz aquifer in south-east morocco
WATER CONSERVATION AND MANAGEMENT, 2024
Precipitation variability determinants in the highlands of lesotho


 DownLoad:


 粤公网安备 44010502001741号
