
Numerical simulation on untrammeled settlement process of falling-net
-
摘要:
通过集中质量法建立罩网网具的数学模型,对罩网自由沉降过程进行数值模拟研究。模拟结果通过罩网4种配重沉降试验实测数据的验证,并展示了罩网自由沉降过程的空间形状变化。研究发现:1)随沉降进行罩网网口形状变为近似圆形,迎流面较圆钝,背流面存在沿海流方向的突出部;2)4种配重间网口质量点拉力、水动力、沉降速度均存在显著性差异且随配重的增加而增大;3)网口质量点的拉力先骤然增大,之后呈现先变小后增大的波动,最后缓慢增大;网口质量点的水动力、沉降速度先骤然变小,之后呈现先增大后变小的波动,最后缓慢减小;4)研究认为在罩网作业所允许的配重范围内,沉降速度随配重的不断增加而持续增大。
Abstract:The lumped mass method was adopted to build the mathematical model of falling-net, and the untrammeled settlement process was studied by numerical simulation method. The simulated results which were verified by measured data in settlement test of four different weights show that the change of falling-net space shaped in the untrammeled settlement process. The study shows that:1) the shape of net mouth became approximate circular along with the settlement, obtuse on the side of against the current, and salient along the direction of the current on the other side; 2) there was significant difference in tension, hydrodynamic force and sinking speed of the mass point in the net mouth among four weights and all of them increased with the weight; 3) the tension of the mass point in the net mouth increased sharply at first, then showed a decrease-increase fluctuation, and increased slowly at last. The hydrodynamic force and sinking speed decreasd sharply at first, then showed an increase-decrease fluctuation, and decreased slowly at last; 4) the study suggests that the sinking speed continues to increase with weight in the allowable weight range of falling-net.
-
巢湖地处长江中下游的安徽省中部,是我国著名的五大淡水湖之一,其地理坐标为东径117°16′54″~117°51′46″,北纬30°25′28″~31°43′28″,属长江左岸水系。全流域面积9 173 km2,涉及7县2市,地貌总体呈南北高,中间低,杭埠河、白石天河、兆河等主要河流呈向心状分布。湖区跨越2市、3县、1区,是沿湖地区工农业生产和群众生活用水的重要水源,是渔业生产的重要基地。农业部渔业生态环境监测中心将其作为编制2004年《中国渔业生态环境状况公报》的重点渔业水域,进行渔业生态环境监测。本文通过对调查、测定的结果进行综合分析,应用层次分析决策法对巢湖渔业生态环境进行评价。
1. 采样点选择及监测项目
通过对近年巢湖渔业调查分析,结合水域特点及入湖河流状况,确定了5月份巢湖鱼类生态环境监测点,见图 1。
监测项目:
(1) 生物环境监测:叶绿素a、浮游植物、浮游动物;
(2) 水质监测:水温、透明度、pH、溶解氧、电导率、总氮、总磷、非离子氨、高锰酸盐指数、铜、锌、铅、镉、汞、砷、石油类、挥发酚。
2. 层次分析
人们在决策过程中,往往会遇到无法定量化的因素,因而影响到决策的质量。美国著名运筹学家Saaty教授于20世纪70年代中期创立的层次分析法(Analytic Hierarchy Process,AHP)是一种能用来处理复杂的社会、政治、经济、科学技术等决策问题的新方法[1, 2]。渔业生态环境综合评价涉及到水域的生物环境和水质环境等多个因素,其环境的优劣类似一个多目标决策问题。它可在确定渔业最优环境这个总目标下,划分各分指标层和方案层,结合水环境综合评价的特点,建立评定渔业最优环境的层次结构模型。
2.1 建立递阶层次结构[3, 4, 9]
根据巢湖水域渔业环境的特点,结合生物监测、水质监测的结果,建立了巢湖水域渔业环境优劣评价系统的递阶层次结构。见图 2。
图 2中,最上层是目标层,各监测点渔业环境的优劣排序;第二层是指标层,该层因素为渔业环境两大类环境因子,因两大类环境因子优劣判断标准有差异,故这里把它们区分开,再细分成分指标层;最低层为方案层,即由不同指标数值组成的各监测点。
2.2 构造各层因素间的比较判断矩阵[5-8]
2.2.1 建立三标度比较矩阵
根据图 2的递阶层次结构,建立最上层至最低层逐层构造有关因素之间的两两比较判断矩阵。亦即对上一层某因素而言,在其下一层次上所有与它关联的因素中依次两两比较两者的重要性或有利关系,对指标而言按“重要”、“同等重要”和“不重要”,对方案而言按“有利”、“同样有利”和“不利”,分别用“2”、“1”和“0”三种数值标度定量表示。由此得出的三标度矩阵,它表示了各因素之间相对于上一层某因素的重要性或有利关系。如A因素与下一层次中的B1,B2,…,Bn有联系,其三标度矩阵的一般形式为:
A B1 B2 … Bn B1 b11 b12 … b1n B2 b21 b22 … b2n $\vdots $ $\vdots $ $\vdots $ $\vdots $ $\vdots $ Bn bn1 bn2 … bnn 或$ B=\left[\begin{array}{cccc} b_{11} & b_{12} & \cdots & b_{1 n} \\ b_{21} & b_{22} & \cdots & b_{2 n} \\ \vdots & \vdots & \vdots & \vdots \\ b_{n 1} & b_{n 2} & \cdots & b_{n n} \end{array}\right]=\left(b_{i j}\right)_{n \times n}$其中
$$ b_{i j}= \begin{cases}2 & \text { 在 } A \text { 因素下, } B_i \text { 比 } B_j \text { 重要或有利 } \\ 1 & \text { 在 } A \text { 因素下, } B_i \text { 与 } B_j \text { 同样重要或有利 } \\ 0 & \text { 在 } A \text { 因素下, } B_i \text { 没有 } B_j \text { 重要或有利 }\end{cases} $$ 且有bii=1,即在A因素下,Bi自身比较,重要性或有利关系相同。
按上述方法,巢湖宜渔指标,据专家定权法建立三标度比较矩阵分别为:
A1—B A1 B1 B2 B3 B4 B5 B6 B7 ri 基点base point B1 1 2 0 0 2 2 0 7 rmax=13→B3
rmin=1 →B2
dm(B3: B2)=7B2 0 1 0 0 0 0 0 1 B3 2 2 1 2 2 2 2 13 B4 2 2 0 1 2 2 2 11 B5 0 2 0 0 1 0 0 3 B6 0 2 0 0 2 1 0 5 B7 2 2 0 0 2 2 1 9 B1—C B1 C1 C2 C3 C4 C5 ri 基点base point C1 1 0 2 2 1 6 rmax=9→C2
rmin=1 →C3
dm(C2: C3)=5C2 2 1 2 2 2 9 C3 0 0 1 1 0 1 C4 0 0 2 2 0 3 C5 1 0 2 2 1 6 B2—C B2 C1 C2 C3 C4 C5 ri 基点base point C1 1 2 2 0 0 5 rmax=9→C5
rmin=1→C3
dm(C5: C3)=3C2 0 1 2 0 0 3 C3 0 0 1 0 0 1 C4 2 2 2 1 0 7 C5 2 2 2 2 1 9 B3—C B3 C1 C2 C3 C4 C5 ri 基点base point C1 1 2 2 2 2 9 rmax=9→C1
rmin=1 →C4
dm(C1: C4)=5C2 0 1 0 2 0 3 C3 0 2 1 2 0 5 C4 0 0 0 1 0 1 C5 0 2 2 2 1 7 B4—C B4 C1 C2 C3 C4 C5 ri 基点base point C1 1 0 0 0 0 1 rmax=9→C5
rmin=1→C1
dm(C5: C1)=3C2 2 1 2 2 0 7 C3 2 0 1 2 0 5 C4 2 0 0 1 0 3 C5 2 2 2 2 1 9 B5—C B5 C1 C2 C3 C4 C5 ri 基点base point C1 1 0 0 0 0 1 rmax=9→C3
rmin=1→C1
dm(C3: C1)=7C2 2 1 0 2 2 7 C3 2 2 1 2 2 9 C4 2 0 0 1 2 5 C5 2 0 0 0 0 3 B6—C B6 C1 C2 C3 C4 C5 ri 基点base point C1 1 0 0 0 0 1 rmax=9→C4
rmin=1→C1
dm(C4: C1)=3C2 2 1 0 0 2 5 C3 2 2 1 0 2 7 C4 2 2 2 1 2 9 C5 2 0 0 0 1 3 B7—C B7 C1 C2 C3 C4 C5 ri 基点base point C1 1 0 0 0 0 1 rmax=7→C2、C4、C5
rmin=1→C1
dm(C2: C1)=3C2 2 1 2 1 1 7 C3 2 0 1 0 0 3 C4 2 1 2 1 1 7 C5 2 1 2 1 1 7 2.2.2 求出AHP间接判断矩阵
三标度比较矩阵并不能准确地反映各因素在某准则下的相对重要性程度,因此必须将其变换成具有层次分析法特点和性质的间接判断矩阵。首先,计算各因素的排序指数:
$$ r_i=\sum\limits_{j=1}^n b_{i j} \quad \mathrm{i}=1, 2, \cdots, n $$ 再找出最大排序指数rmax和最小排序指数rmin:
$$ \begin{aligned} & r_{\max }=\max _{1 \leq i \leq n}\left\{r_i\right\} \\ & r_{\min }=\min _{1 \leq i \leq n}\left\{r_i\right\} \end{aligned} $$ 以Bmax、Bmin分别表示与rmax、rmin对应的因素,则当选取Bmax、Bmin作为基点比较因素,并按9标度数值给出这个基点的相对重要程度dm后,利用下面的变换式可求得反映各因素间相对重要性程度的AHP间接判断矩阵:
$$ D=\left[\begin{array}{cccc} d_{11} & d_{12} & \cdots & d_{1 n} \\ d_{21} & d_{22} & \cdots & d_{2 n} \\ \vdots & \vdots & \vdots & \vdots \\ d_{n 1} & d_{n 2} & \cdots & d_m \end{array}\right]=\left(d_{i j}\right)_{n \times n} $$ $$ d_{i j}= \begin{cases}\frac{r_i-r_j}{r_{\max }-r_{\min }}\left(d_m-1\right)+1 & r_i-r_j \geq 0 \\ {\left[\frac{r_j-r_i}{r_{\max }-r_{\min }}\left(d_m-1\right)+1\right]^{-1}} & r_i-r_j<0\end{cases} $$ 采用ri计算式算得ri各值,列在每一比较矩阵的倒数第二列,rmax、rmin以及它们对应的Bmax、Bmin的基点相对重要性程度dm,列在每一比较矩阵的最后一列。然后利用dij计算式算得各个AHP间接判断矩阵如下:
A1—B A1 B1 B2 B3 B4 B5 B6 B7 权向量
weight vector一致性检验
consistency checkB1 1 4 1/4 1/3 3 2 1/2 0.1040 λmax=7.1952
C.I.=0.0325
R.I.=1.32
C.R.=0.0246B2 1/4 1 1/7 1/6 1/2 1/3 1/5 0.0308 B3 4 7 1 2 6 5 3 0.3517 B4 3 6 1/2 1 5 4 2 0.2412 B5 1/3 2 1/6 1/5 1 1/2 1/4 0.0449 B6 1/2 3 1/5 1/4 2 1 1/3 0.0678 B7 2 5 1/3 1/2 4 3 1 0.1596 B1—C B1 C1 C2 C3 C4 C5 权向量
weight vector一致性检验
consistency checkC1 1 2/5 7/2 5/2 1 0.2078 λmax=5.0602
C.I.=0.0150
R.I.=1.12
C.R.=0.0134C2 5/2 1 5 4 5/2 0.4250 C3 2/7 1/5 1 1/2 2/7 0.0618 C4 2/5 1/4 2 1 2/5 0.0976 C5 1 2/5 2/7 5/2 1 0.2078 B2—C B2 C1 C2 C3 C4 C5 权向量
weight vector一致性检验
consistency checkC1 1 3/2 2 2/3 1/2 0.1821 λmax=5.0596
C.I.=0.0149
R.I.=1.12
C.R.=0.0133C2 2/3 1 2/3 1/2 2/5 0.1122 C3 1/2 3/2 1 2/5 1/3 0.1149 C4 3/2 2 5/2 1 2/3 0.2513 C5 2 5/2 3 3/2 1 0.3395 B3—C B3 C1 C2 C3 C4 C5 权向量
weight vector一致性检验
consistency checkC1 1 4 3 5 2 0.4174 λmax=5.0682
C.I.=0.0170
R.I.=1.12
C.R.=0.0152C2 1/4 1 1/2 2 1/3 0.0975 C3 1/3 2 1 3 1/2 0.1602 C4 1/5 1/2 1/3 1 1/4 0.0615 C5 1/2 3 2 4 1 0.2634 B4—C B4 C1 C2 C3 C4 C5 权向量
weight vector一致性检验
consistency checkC1 1 2/5 1/2 2/3 1/3 0.0975 λmax=5.0143
C.I.=0.0036
R.I.=1.12
C.R.=0.0032C2 5/2 1 3/2 2 2/3 0.2506 C3 2 2/3 1 3/2 1/2 0.1816 C4 3/2 1/2 2/3 1 2/5 0.1317 C5 3 3/2 2 5/2 1 0.3386 B5—C B5 C1 C2 C3 C4 C5 权向量
weight vector一致性检验
consistency checkC1 1 2/11 1/7 1/4 2/5 0.0435 λmax=5.1464
C.I.=0.0366
R.I.=1.12
C.R.=0.0327C2 11/2 1 2/5 5/2 4 0.2656 C3 7 5/2 1 4 11/2 0.4707 C4 4 2/5 1/4 1 5/2 0.1431 C5 5/2 1/4 2/11 2/5 1 0.0771 B6—C B6 C1 C2 C3 C4 C5 权向量
weight vector一致性检验
consistency checkC1 1 1/2 2/5 1/3 2/3 0.0974 λmax=5.0143
C.I.=0.0036
R.I.=1.12
C.R.=0.0032C2 2 1 2/3 1/2 3/2 0.1817 C3 5/2 3/2 1 2/3 2 0.2506 C4 3 2 3/2 1 5/2 0.3386 C5 3/2 2/3 1/2 2/5 1 0.1317 B7—C B7 C1 C2 C3 C4 C5 权向量
weight vector一致性检验
consistency checkC1 1 1/3 3/5 1/3 1/3 0.0840 λmax=5.0080
C.I.=0.0020
R.I.=1.12
C.R.=0.0018C2 3 1 7/3 1 1 0.2654 C3 5/3 2/7 1 3/7 3/7 0.1198 C4 3 1 7/3 1 1 0.2654 C5 3 1 7/3 1 1 0.2654 2.3 由AHP间接判断矩阵计算权重[4, 8]
求解出间接判断矩阵的最大特征值λmax、C.I.及对应的特征量,将其归一化后即为某一层的有关因素相对于上一层相关因素的权重值。判断矩阵的一致性可用λmax、C.I.、R.I.和C.R.指标来检验,C.I.=(λmax-n)/(n-1),R.I.按表 1确定,随机一致性比值C.R.=C.I./R.I.,当C. I.<0.1时,则认为判断矩阵符合一致性要求。
表 1 平均一致性指标Table 1. The average consistency indicatorn 1 2 3 4 5 6 7 8 9 R.I. 0 0 0.58 0.90 1.12 1.24 1.32 1.41 1.45 用方根法求出各个间接判断矩阵的权向量和一致性检验指标,分别列在每个间接判断矩阵的后两列。然后求出5个监测点C1、C2、C3、C4和C5对于宜渔指标A1而言,相对优劣排序及一致性检验,见表 2。
表 2 A1—B—C层次总排序Table 2. The general arrangement for layers A1—B—CA1 B1
0.1040B2
0.0308B3
0.3517B4
0.2412B5
0.0449B6
0.0678B7
0.1596层次总排序
layers sequencing一致性检验
consistency checkC1 0.2078 0.1821 0.4174 0.0975 0.0435 0.0974 0.0840 0.2195 C.I.=0.0111
R.I.=1.12
C.R.=0.0099C2 0.4250 0.1122 0.0975 0.2506 0.2656 0.1817 0.2654 0.2091 C3 0.0618 0.1149 0.1602 0.1816 0.4707 0.2506 0.1198 0.1674 C4 0.0976 0.2513 0.0615 0.1317 0.1431 0.3386 0.2654 0.1430 C5 0.2078 0.3395 0.2634 0.3386 0.0771 0.1317 0.2654 0.2610 由表 2可见,相对于宜渔指标A1这个目标而言,5个监测点C1、C2、C3、C4和C5相对优劣排序为:C5>C1>C2>C3>C4。因此,E点宜渔指标最好。
按照上面方法,分析巢湖水质指标,计算出A2—B—C层次总排序,见表 3。
表 3 A2—B—C层次总排序Table 3. The general arrangement for layers A2—B—CA2 B1
0.5690B5
0.0523B6
0.2741B8
0.0523B9
0.0523层次总排序
layers sequncing一致性检验
consistency checkC1 0.1253 0.0435 0.0615 0.0615 0.0615 0.0969 C.I.=0.0169 R.I.=1.12 C.R.=0.0151 C2 0.0613 0.1431 0.1602 0.0975 0.2634 0.1051 C3 0.4213 0.0771 0.2634 0.1602 0.4174 0.3462 C4 0.2668 0.2656 0.4174 0.4174 0.1602 0.3103 C5 0.1253 0.4707 0.0975 0.2634 0.0975 0.1415 由表 3可见,相对于水质指标A2这个目标而言,5个监测点C1、C2、C3、C4和C5相对优劣排序为:C3>C4>C5>C2>C1。因此,C点水质指标最好。
最后,求出宜渔指标A1和水质指标A2对于巢湖渔业环境优劣总目标层M的层次的排序及一致性检验,见表 4。
表 4 M—A—B—C层次总排序Table 4. The general arrangement for layers A3—B—CM A1
0.35A2
0.65层次总排序
layers sequencing一致性检验
consistency checkC1 0.2195 0.0969 0.1398 C.I.=0.01149
R.I.=1.12
C.R.=0.0133C2 0.2091 0.1051 0.1416 C3 0.1674 0.3462 0.2836 C4 0.1430 0.3103 0.2517 C5 0.2610 0.1415 0.1833 由表 4可见,相对于巢湖渔业环境优劣总目标层M而言,通过综合宜渔指标A1和水质指标A2等多因素的评判,最后得出5个监测点相对优劣总排序为:C3>C4>C5>C2>C1。因此,巢湖渔业环境C3(即监测点C)点指标最好。
3. 讨论
巢湖渔业环境5个监测点,C点渔业环境相对最好。C点水体单元位于巢湖东湖湖心,外源性污染影响较小,水域环境相对稳定,该水域同其它水域之间存在着明显的差异。从C点的生物环境来看,该点的蓝藻数量亦最低;蓝藻数量低,其对其它浮游生物的抑制作用就小,该点的生物多样性就会增加,区域内的小生境就会较其它水域好。从叶绿素a监测的结果可以看出C点的含量最低(0.094 μg · L-1),低于一般湖泊富营养化标准值(0.1 μg · L-1)。从C点的水质环境来看,监测的17个因子中,有14个优于渔业水质标准;有3个超标,分别是总氮、总磷和石油类,该域水质总体尚可。
巢湖A点渔业环境相对最差。从A点的生物环境来看,该点的浮游生物数量和生物量都最高,其蓝藻数量也是全湖中最高的。从A点的水质环境来看,A点在巢湖的西湖区,有着众多的入湖河口,如南淝河、派河、丰乐河、杭埠河等,其中南淝河、派河向巢湖排入大量的城市污水,也是导致巢湖富营养化的主要原因之一,在水质监测结果中,A点的水质超标因子数是最多的。
监测点D、E同处巢湖的东部,巢湖地处亚热带江淮平原,夏季主导风向为东南风,处上风口;D点采样点在东口门,距柘皋河口与裕溪河口较近,E点采样点距烔炀河口较近。B点处于巢湖南部,距马尾河口不远,同D点、E点水体单元在地理、气象、水文、生物环境等方面具有较显著的相似性,仅区别于入湖径流不同。层次分析的结果说明,D点渔业环境优于E点,E点优于B点。
因此,从AHP的分析结果可以看出,巢湖水域的渔业生态环境,东湖湖心最好,东湖近岸水域次之,西湖水域最差。
-
![]()
图 2 SDKN-500型网位仪及罩网模型网口质量点位置示意图
Figure 2. Position of SDKN-500 net monitor and mass points in net mouth of falling-net model
![]()
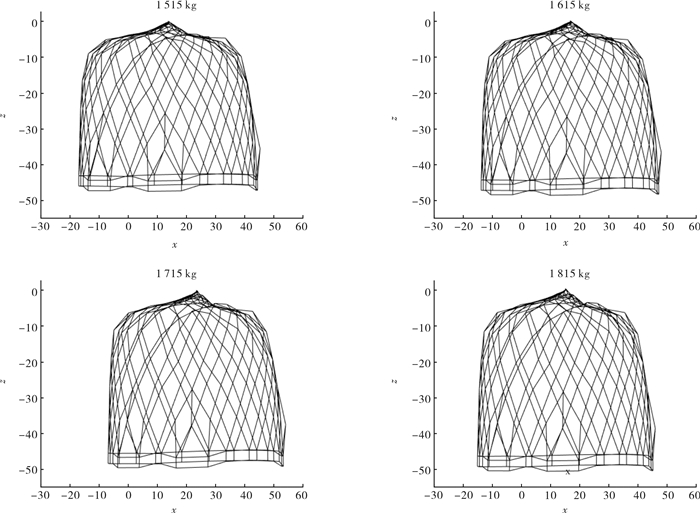
图 4 1 815 kg配重下罩网自由沉降过程空间形状(单位:m)
Figure 4. Space shape of falling-net by weight of 1 815 kg in untrammeled settlement
![]()
图 5 4种配重下沉降第108秒时罩网空间形状俯视图(单位:m)
Figure 5. Planform of falling-net space shape at 108th second after settling among four weights
![]()
图 6 4种配重下沉降第108秒时罩网的空间形状正视图(单位:m)
Figure 6. Front view of falling-net space shape at 108th second after settling among four weights
![]()
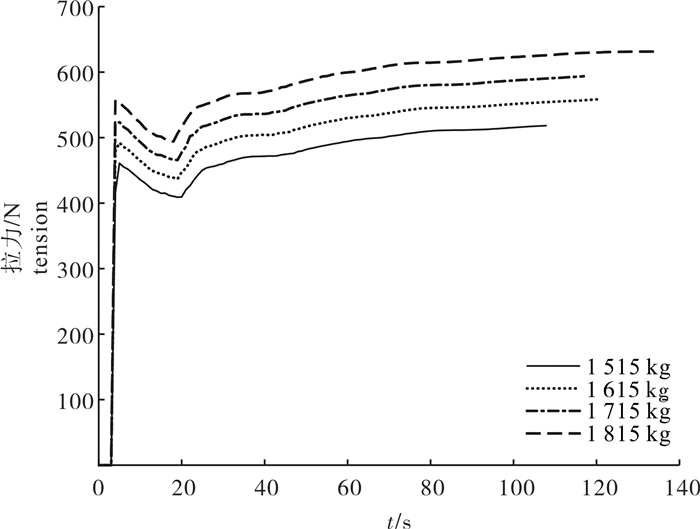
图 7 4种配重间网口质量点拉力的比较
Figure 7. Comparison of tension of mass points in net mouth among four weights
![]()
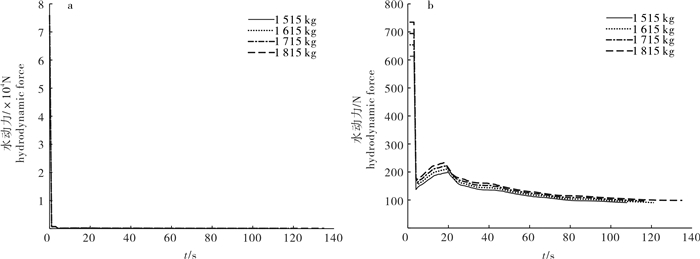
图 8 4种配重间网口质量点水动力的比较
a.从第0秒开始;b.从第1秒开始
Figure 8. Comparison of hydrodynamic force of mass points in net mouth among four weights
a. start from 0th second; b. start from 1th second
![]()
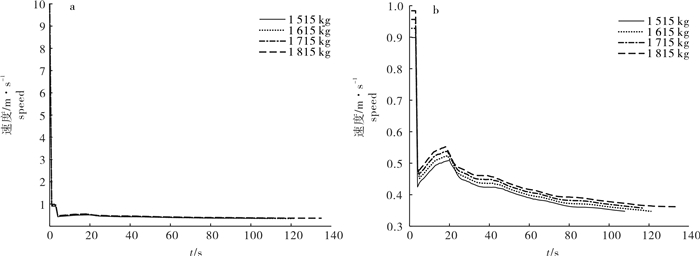
图 9 4种配重间网口质量点沉降速度比较
a.从第0秒开始;b.从第1秒开始
Figure 9. Comparison of sinking speed of mass points in net mouth among four weights
a. start from 0th second; b. start from 1th second
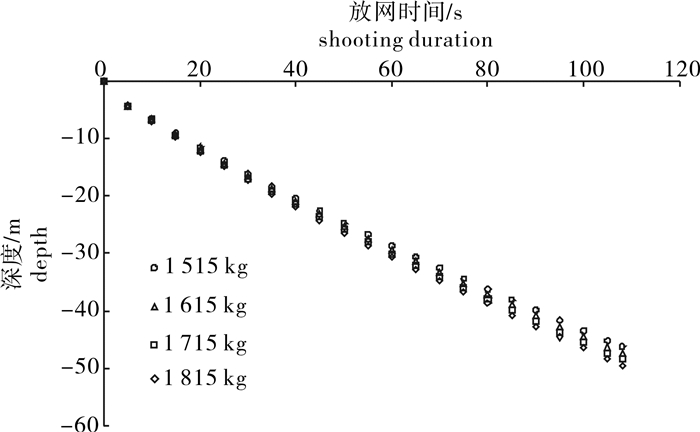
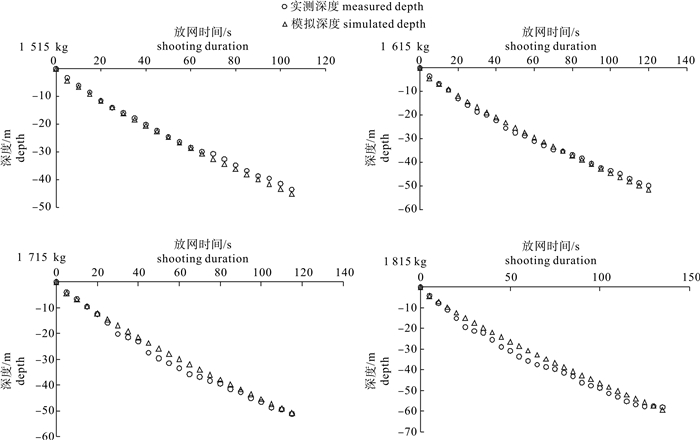
![]()
图 10 4种配重间网口质量点模拟沉降深度比较
Figure 10. Comparison of simulated sinking depth of mass points in net mouth among four weights
表 1 实物网与网目群化后模型网参数的比较
Table 1 Comparison between actual falling-net and falling-net model after mesh grouping
实物网网目数/行×列actual falling-net row×column 网目尺寸/mm mesh size 直径/mm
diameter群化的网目数/行×列
meshgrouping row×column模型网网目数/行×列
falling-net model row×column网目尺寸/m
mesh size直径/m
diameter缘网衣fringe net 44×6 480 80 1.12/ 1.44 44×295 1×22 5.72/ 27.58* 0.010 4 网身第一段first net body 585.5×13 104 35 0.55 600×600 1×22 21.00 0.013 5 网身第二段second net body 600.5×11 648 30 0.55 610×610 1×19 18.30 0.013 6 网身第三段third net body 280.5×10 192 30 0.55 540×540 0.5×19 16.20 0.012 8 网身第四段forth net body 320.5×8 763 25 0.55 630×630 0.5×14 15.75 0.013 8 网身第五段fifth net body 230.5×5 824 25 0.55 450×450 0.5×13 11.25 0.011 7 网囊第一段first cod-end 240.5×3 000 25 0.56 250×250 1×12 6.25 0.008 9 网囊第二段second cod-end 168.5×2 000 25 0.56 168×168 1×12 4.20 0.007 3 网囊第三段third cod-end 168.5×1 000 25 0.56 168×168 1×6 4.20 0.007 3 网囊第四段forth cod-end 142.5×700 28 0.8 142×142 1×5 3.98 0.009 5 网囊第五段fifth cod-end 250.5×300 20 1.92 60×60 4×5 1.20 0.014 9 注:*.因规格小群化为矩形网目,数字分别为矩形的宽度与长度。
Note:*. mesh grouping to rectangular mesh because of small size;the numbers are width and length of rectangle,respectively. 下载: 导出CSV
-
[1] 张鹏, 杨吝, 张旭丰, 等.南海金枪鱼和鸢乌贼资源开发现状及前景[J].南方水产, 2010, 6(1):68-74. http://kns.cnki.net/KCMS/detail/detail.aspx?filename=nfsc201001014&dbname=CJFD&dbcode=CJFQ [2] 张鹏, 曾晓光, 杨吝, 等.南海区大型罩网渔场渔期和渔获组成分析[J].南方水产科学, 2013, 9(3):74-79. http://www.schinafish.cn/CN/abstract/abstract9036.shtml [3] 邱永松, 张鹏. 南海大洋性渔业资源开发利用对策建议[C]//热带海洋科学学术研讨会暨第八届广东海洋湖沼学会. 第七届广东海洋学会会员代表大会论文及摘要汇编. 2013: 199-203. http://cpfd.cnki.com.cn/Article/CPFDTOTAL-GDKL201305001026.htm [4] 晏磊, 张鹏, 杨吝, 等.南海灯光罩网沉降性能研究[J].上海海洋大学学报, 2014, 23(1):146-153. http://kns.cnki.net/KCMS/detail/detail.aspx?filename=ssdb201401022&dbname=CJFD&dbcode=CJFQ [5] 李杰, 晏磊, 陈森, 等.灯光罩网网口沉降与闭合性能研究[J].南方水产科学, 2015, 11(5):117-124. http://www.schinafish.cn/CN/abstract/abstract9387.shtml [6] 李杰, 晏磊, 陈森, 等.基于不同配重的罩网沉降性能研究[J].南方水产科学, 2016, 12(5):16-22. http://www.schinafish.cn/CN/abstract/abstract9377.shtml [7] LEE C W, CHA B J. Dynamic simulation of a midwater trawl system′s behavior[J].Fish Sci, 2002, 68:1865-1868. doi: 10.2331/fishsci.68.sup2_1865
[8] LEE C W, LEE J H, CHA B J, et al.Physical modeling for underwater flexible systems dynamic simulation[J].Ocean Engin, 2005, 32(3/4):331-347. http://www.sciencedirect.com/science/article/pii/S0029801804001532
[9] SUN X F, YIN Y, JIN Y C, et al.The modeling of single-boat, mid-water trawl systems for fishing simulation[J].Fish Res, 2011, 109(1):7-15. doi: 10.1016/j.fishres.2010.12.027
[10] 陈英龙, 赵勇刚, 周华, 等.大型中层拖网网具系统的仿真研究[J].浙江大学学报(工学版), 2014, 48(4):625-632. http://kns.cnki.net/KCMS/detail/detail.aspx?filename=zdzc201404010&dbname=CJFD&dbcode=CJFQ [11] NGUYEN T X, WINGER P D, ORR D, et al. Computer simulation and flume tank testing of scale engineering models:how well do these techniques predict full-scale at-sea performance of bottom trawls?[J].Fish Res, 2015, 161:217-225. doi: 10.1016/j.fishres.2014.08.007
[12] KIM H Y, LEE C W, SHIN J K, et al. Dynamic simulation of the behavior of purse seine gear and sea-trial verification[J].Fish Res, 2007, 88(1/2/3):109-119. http://www.sciencedirect.com/science/article/pii/S0165783607001920
[13] KIM Y H, PARK M C.The simulation of the geometry of a tuna purse seine under current and drift of purse seiner[J].Ocean Engin, 2009, 36(14):1080-1088. doi: 10.1016/j.oceaneng.2009.06.011
[14] HOSSEINI S A, LEE C W, KIM H S, et al. The sinking performance of the tuna purse seine gear with large-meshed panels using numerical method[J].Fish Sci, 2011, 77(4):503-520. doi: 10.1007/s12562-011-0371-6
[15] RIZIOTIS V A, KATSAOUNIS G M, PAPADAKIS G, et al. Numerical and experimental analysis of the hydroelastic behavior of purse seine nets[J].Ocean Engin, 2013, 58:88-105. doi: 10.1016/j.oceaneng.2012.09.022
[16] ZHOU C, XU L X, ZHANG X F, et al. Application of numerical simulation for analysis of sinking characteristics of purse seine[J].J Ocean Univ China, 2015, 14(1):135-142. doi: 10.1007/s11802-015-2384-8
[17] WAN R, CUI J H, SONG X F, et al. A numerical model for predicting the fishing operation status of tuna longlines[J].水产学报, 2005, 29(2):238-245. http://en.cnki.com.cn/Article_en/CJFDTOTAL-SCKX200502017.htm [18] LEE J H, LEE C W, CHA B J. Dynamic simulation of tuna longline gear using numerical methods[J].Fish Sci, 2005, 71(6):1287-1294. doi: 10.1111/fis.2005.71.issue-6
[19] 宋利明, 张智, 袁军亭, 等.基于有限元分析的漂流延绳钓渔具作业状态数值模拟[J].海洋与湖沼, 2011, 42(2):256-261. doi: 10.11693/hyhz201102014014 [20] 宋利明, 张智, 袁军亭, 等.基于最小势能原理的延绳钓渔具作业状态数值模拟[J].中国水产科学, 2011, 18(5):1170-1178. http://kns.cnki.net/KCMS/detail/detail.aspx?filename=zsck201105025&dbname=CJFD&dbcode=CJFQ [21] LEE J, LEE C W, KARLSEN L.Sea trials and application of a numerical method for the analysis of the ocean current displacement phenomena of demersal longlines[J].Ocean Engin, 2011, 38(16):1744-1754. doi: 10.1016/j.oceaneng.2011.08.003
[22] SONG L M, LI J, XU W Y, et al. The dynamic simulation of the pelagic longline deployment[J].Fish Res, 2015, 167:280-292. doi: 10.1016/j.fishres.2015.03.005
[23] 刘莉莉, 万荣, 黄六一, 等.波流场中张网渔具水动力学特性的数值模拟[J].中国海洋大学学报(自然科学版), 2013, 43(5):24-29. http://kns.cnki.net/KCMS/detail/detail.aspx?filename=qdhy201305005&dbname=CJFD&dbcode=CJFQ [24] 苏炜, 詹杰民.等效网面法在模拟网的水动力特性中的应用[J].水动力学研究与进展A辑, 2007, 22(3):267-272. http://kns.cnki.net/KCMS/detail/detail.aspx?filename=sdlj200703002&dbname=CJFD&dbcode=CJFQ [25] 曹道梅. 金枪鱼漂流延绳钓渔具动力学模拟[D]. 上海: 上海海洋大学, 2011: 1-53. http://www.paper.edu.cn/html/releasepaper/2012/10/172/ [26] 王敏法. 金枪鱼围网网具数值模拟初步研究[D]. 上海: 上海海洋大学, 2011: 1-52. http://cdmd.cnki.com.cn/Article/CDMD-10264-1011305060.htm [27] 苏炜, 詹杰民.水流作用下渔网养殖空间变化的计算方法[J].海洋工程, 2007, 25(1):93-100. http://kns.cnki.net/KCMS/detail/detail.aspx?filename=hygc200701014&dbname=CJFD&dbcode=CJFQ [28] 黄小华, 郭根喜, 陶启友, 等.平面网衣在水流作用下的受力和变形特性数值模拟研究[J].南方水产, 2009, 5(3):23-29. http://kns.cnki.net/KCMS/detail/detail.aspx?filename=nfsc200903005&dbname=CJFD&dbcode=CJFQ [29] 黄小华, 郭根喜, 胡昱, 等.水流作用网衣过程的数值模拟[J].南方水产科学, 2011, 7(3):56-61. http://www.schinafish.cn/CN/abstract/abstract8876.shtml [30] LI Y C, ZHAO Y P, GUI F K, et al. Numerical simulation of the hydrodynamic behaviour of submerged plane nets in current[J].Ocean Engin, 2006, 33(17/18):2352-2368. http://www.sciencedirect.com/science/article/pii/S0029801806000370
[31] 吴喜之.统计学:从数据到结论[M].4版.北京:中国统计出版社, 2013:93. [32] KABACOFF R I.R语言实战[M].北京:人民邮电出版社, 2013:152-154. [33] 万荣, 何鑫, 王欣欣, 等.一种适用于网箱耐流特性有限元分析的网目群化方法[J].中国海洋大学学报(自然科学版), 2007, 37(6):885-888. http://kns.cnki.net/KCMS/detail/detail.aspx?filename=qdhy200706007&dbname=CJFD&dbcode=CJFQ [34] 许柳雄, 兰光查, 叶旭昌, 等.下纲重量和放网速度对金枪鱼围网下纲沉降速度的影响[J].水产学报, 2011, 35(10):1563-1571. http://kns.cnki.net/KCMS/detail/detail.aspx?filename=sckx201110019&dbname=CJFD&dbcode=CJFQ [35] 李灵智, 黄洪亮, 陈帅, 等.基于静水池模型试验的金枪鱼围网沉降性能研究[J].中国海洋大学学报(自然科学版), 2015, 45(3):48-53. http://kns.cnki.net/KCMS/detail/detail.aspx?filename=qdhy201503007&dbname=CJFD&dbcode=CJFQ [36] 冯维山.沉力分布对平面网片沉降特性影响的试验[J].大连水产学院学报, 1996, 11(4):37-44. http://kns.cnki.net/KCMS/detail/detail.aspx?filename=dlsc604.004&dbname=CJFD&dbcode=CJFQ -
期刊类型引用(2)
1. 李杰,张鹏,王腾,晏磊,杨炳忠,陈作志. 基于广义加性模型研究影响罩网沉降性能的因子. 南方水产科学. 2021(04): 74-81 .  本站查看
本站查看
2. 晏磊,李杰,杨炳忠,张鹏. 光诱罩网沉降性能对鸢乌贼渔获率的影响. 南方水产科学. 2018(04): 10-16 . 本站查看
其他类型引用(1)


计量
- 文章访问数: 3421
- HTML全文浏览量: 1069
- PDF下载量: 742
- 被引次数: 3
 粤公网安备 44010502001741号
