
Effects of parent acclimation and heat-shock at gastrula on growth and development of sea cucumber larvae
-
摘要:
文章探讨了刺参(Apostichopus japonicus)亲本南方驯化和囊胚期幼体热应激对浮游幼体生长、发育的影响。刺参亲本分为未度夏(DA)组和已度夏(XP)组,每组设置对照组(C)和热应激组(H),在囊胚期对H组进行45 min、26 ℃的高温应激,然后分别在18 ℃和23 ℃下培育至变态。结果表明,培育温度对H组和C组幼体的生长有显著影响,C组幼体在23 ℃下的特定生长率高于18 ℃,而H组正好相反。从耳状幼体第2天开始,DA组和XP组幼体的最大体长开始出现在H组,这与幼体对饵料的摄取有关。H组幼体的变态率要显著低于C组,这归因于高温应激导致的高畸形率。DA组和XP组幼体的生长、成活以及附着变态率之间差异不显著。鉴于之前研究结果,可通过下述途径获取耐高温刺参苗种:首先在囊胚期进行高温应激获取耐高温幼参,然后在南方进行幼体培育和中间养成,性成熟后进行苗种繁育,最后经过累代选育固定耐高温性状。
Abstract:This study investigated the effects of parent-acclimation and heat-shock at gastrula stage on growth and development of sea cucumber (Apostichopus japonicus) larvae. The adult sea cucumbers were split into two groups: DA group and XP group, each with two treatments: control (C) and heat-shock (H). Gastrula larvae of H were heated at 26 ℃ for 45 min and then reared at 18 ℃ and 23 ℃ separately until metamorphosis. Results show that the specific growth rate at 23 ℃ was higher than that at 18 ℃ in the control, but the trend was opposite in heat-shock treatment. Since the 2nd day of auricularia, the maximum body length had been observed in heat-shock treatment for both DA and XP group, which was due to the ingestion of food. The setting rate of heat-shock treatment was significantly lower than that of the control due to the high rate of deformed individuals caused by heat-shock. Thus, high temperature-resistant sea cucumbers can be acquired via the following steps: first, obtain a certain number of high temperature-resistant juveniles by heat-shock at gastrula stage; then, culture these individuals in southern China until sexual maturity; finally, fix the high temperature-resistant properties by generation selection.
-
Keywords:
- sea cucumber /
- thermal acclimation /
- heat-shock /
- growth /
- development /
- thermotolerance
-
由于环境温度会对变温动物的所有生理和生化过程带来实质性的影响,因此环境温度对动物的生长、发育以及成活起到重要的作用[1-2]。驯化温度是影响生物生长、代谢等的关键环境因素之一[3-4]。有研究表明,生物体的生长、发育以及变态受到前期所经历环境温度的影响很大[5-9]。此外,温度应激对生物的发育和成活也有显著的影响。课题组前期的研究表明,在浮游幼体时期对刺参进行高温应激会显著降低幼体成活率,并且幼体畸形率随着温度升高呈上升趋势[10]。
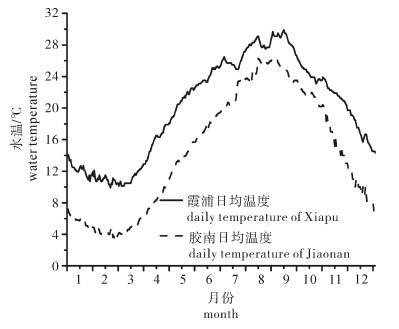
刺参主要在中国北方养殖,在冬季平均气温一般约3 ℃,此时刺参基本上不摄食,从而严重影响了生长。由于中国南方冬季海水温度维持在10 ℃以上,适宜刺参生长,因此北参南养得以大规模开展,主要养殖区域在浙江、福建省。课题组于2012年对中国北方和南方2个典型的海参养殖区——山东省青岛市胶南(36°21′N,120°43′E)室外刺参养殖池塘和福建省宁德市霞浦县(26°41′N,120°06′E)刺参吊笼养殖区域海水温度进行了全年监测,发现霞浦县水温比胶南高3~7 ℃(图 1)。北参南养的大规模开展,延长了刺参的生长时间并有效地提高了刺参的产值。但是2012年北参南养产业的大面积亏损提示整个产业链亟需完善。针对瓶颈问题,培育出适合南方水域的耐高温刺参苗种才是重中之重。课题组前期研究结果表明,高温驯化和囊胚期高温应激均是提高幼参对高温耐受能力的可行途径[10-13],且有研究表明亲本所获得的对高温的适应能力能够遗传给后代(intergenerational response of developmental acclimation)[14-17]。但是关于亲本驯化和囊胚期高温应激对浮游幼体生长、发育影响的研究较少[10, 12]。该研究对比具有不同温度驯化历史的刺参亲本之间以及囊胚期高温应激与对照组之间浮游幼体生长、发育以及变态率的差异,以期丰富刺参热生理生态学研究,并为耐高温苗种筛选提供一定的理论指导。
![]() 图 1 2012年霞浦和胶南全年日均水温对比Figure 1. Comparison of daily water temperature of Xiapu and Jiaonan in 2012
图 1 2012年霞浦和胶南全年日均水温对比Figure 1. Comparison of daily water temperature of Xiapu and Jiaonan in 20121. 材料与方法
1.1 材料来源
根据驯化历史的差异,将亲本(湿体质量>200 g)分成2组:DA组是2012年10月从山东省即墨市购买,然后经过福建省霞浦县越冬的亲参;XP组是2012年5月从山东省即墨市购买,经过福建省霞浦县度夏以及越冬的亲参。所购买亲本来自青岛胶南诚信育苗场同一批亲本繁育的个体,亲本在胶南养殖模式为室外池塘养殖,养殖密度控制在4~5头m-2,驯化期间每2周投喂1次配合饲料(成分包含海藻粉、鱼粉等);在霞浦养殖模式为海上吊笼(鲍鱼笼)养殖,鲍鱼笼每层内表面积0.486 m2,每层饲养湿体质量不超过500 g。亲本南方驯化在福建省宁德市霞浦县一鸣海洋食品有限公司海上渔排进行,驯化期间每周投喂2~3次人工混合饲料(成分包含盐渍海带、杂鱼等)。
于2013年4月中下旬开始进行人工苗种繁育。采用阴干、流水以及升温水结合的方法进行催产。受精卵在18 ℃水温下孵化,密度控制在10~20个mL-1,在原肠期幼虫后期投喂牟氏角毛藻(Chaetoceros muelleri)、盐藻(Dunaliella salina)和海洋红酵母的混合液,投喂量依据幼体的不同发育时期、幼体的摄食活力以及水体中剩余的饵料数量而做适当的调整。幼体全部附着变态后,开始投喂由海带(Laminaria japonica)、鼠尾藻(Sargassum thunbergii)和马尾藻(Sargassum sp.)等藻粉混合制成的配合饲料。整个苗种培育期间不间断充气,光照强度控制在500~1 500 lx,光照周期为14 L : 10 D。水源为沙滤自然海水。每天换水1/2,海水盐度约为30,换水前对海水进行预加热,防止换水造成水族箱温度变化过大。
1.2 实验设计
分对照组(C)和热应激组(H),每组设置18 ℃和23 ℃ 2个幼体培育温度。当幼体发育至囊胚期时,H组进行45 min、26 ℃的高温应激(热应激温度和持续时间参考WANG等[12]),然后在18 ℃(记为H-18)和23 ℃(记为H-23)继续培育至变态。C组不进行热激,分别在18 ℃(记为C-18)和23 ℃(记为C-23)培育至变态。
每个处理设3个重复。实验期间每日测量幼体体长(n=30),并分别于实验开始前及耳状幼体后期记录水体中幼体的数量。幼体全部附着变态5 d后观察统计幼体附着变态情况,计算幼体附着变态率。
1.3 计算与数据分析
实验期间幼体特定生长率(SGR)和成活率(SR)采用以下公式计算:
$$ \operatorname{SGR}\left(\% \cdot \mathrm{~d}^{-1}\right)=100 \times\left(\ln L_{\mathrm{t}}-\ln L_0\right) / T $$ 其中L0、Lt表示开始和结束时测得的刺参幼体体长(μm),T表示取样时间(d)。
$$ \operatorname{SR}(\%)=\left(N_2 / N_1\right) \times 100 $$ N1、N2分别为初始时期和耳状幼体后期幼体数量。
数据统计采用SPSS 13.0进行,不同处理组间体长、成活率以及变态率之间的差异采用单因子方差分析(One-Way ANOVA),相同处理组不同亲本之间体长、成活率以及变态率之间的差异采用独立样本T检验(independent-samples T Test),以P < 0.05作为差异显著的标准。
2. 结果
亲本驯化过程中,DA组和XP组均出现死亡现象,其中DA组的死亡率为(15.002±9.129)%,XP组为(31.666±9.128)%。该研究中浮游幼体在第14天变态为稚参,刺参幼体浮游期(受精卵、囊胚期、原肠期、耳状幼体)持续时间大约8~9 d。
2.1 亲本驯化和囊胚期高温应激对浮游幼体生长和成活的影响
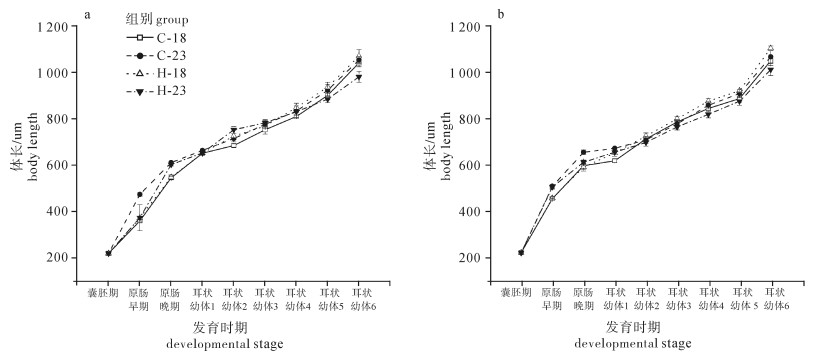
各处理组幼体初始体长没有差异(F(7, 23)=0.414,P>0.05)(表 1)。不同处理组幼体体长日变化见图 2。各组幼体体长均随着培育时间的延长而增加,在耳状幼体第6天时达到最大值。除原肠期以及耳状幼体第1天和第6天外,其余时间各组之间没有显著性差异(原肠早期F(7, 23)=8.664,P < 0.05;原肠晚期F(7, 23)=8.681,P < 0.05;耳状幼体第1天F(7, 23)=3.129,P < 0.05;耳状幼体第2天F(7, 23)=2.044,P>0.05;耳状幼体第3天F(7, 23)=1.542,P>0.05;耳状幼体第4天F(7, 23)=2.482,P>0.05;耳状幼体第5天F(7, 23)=1.390,P>0.05;耳状幼体第6天F(7, 23)=3.633,P < 0.05)。DA组和XP组内体长最大值都出现在18 ℃下培育的H组(DA组1 067.92 μm;XP组1 105.42 μm),且XP组H-18处理组幼体出现体长最大值,但DA组和XP组之间差异不显著(P>0.05)。
表 1 不同处理组幼体体长日变化Table 1. Daily change in body length of larvae among different groups未度夏(DA)组DA group 已度夏(XP)组XP group C-18 C-23 H-18 H-23 C-18 C-23 H-18 H-23 囊胚期BLA 219.00±4.16a 219.00±4.16a 219.00±4.16a 219.00±4.16a 223.00±2.18a 223.00±2.18a 223.00±2.18a 223.00±2.18a 原肠早期early-GAS 359.00±4.54a 472.92±7.23b 372.17±7.17a 373.17±55.93a 456.25±8.20b* 510.00±9.02b 458.75±1.25b* 506.67±9.02b* 原肠晚期late-GAS 544.17±7.26a 609.58±5.22b 546.67±10.52a 601.25±6.17b 598.75±16.88b* 656.67±9.92c* 592.92±16.68b* 613.75±9.92b 耳状幼体1 AUR1 650.00±4.02b* 662.08±1.82b 650.83±7.92b 651.25±6.17b 620.00±7.64a 673.75±3.31b 653.75±14.81b 657.50±3.31b 耳状幼体2 AUR2 682.92±6.55a 712.92±3.97ab 724.17±25.43ab 751.25±14.42b* 714.58±10.86ab 710.00±15.88ab 726.67±13.35ab 699.17±15.88a 耳状幼体3 AUR3 750.83±18.74a 774.58±17.22ab 766.67±2.20ab 780.83±14.51ab 787.92±9.82ab 779.17±12.83ab 801.67±8.61b 766.25±12.83ab 耳状幼体4 AUR4 807.92±4.35a 831.67±4.70abc 846.67±18.62abc 828.75±24.25ab 845.83±13.72abc 860.00±15.68bc 877.50±12.27c 820.83±15.68ab 耳状幼体5 AUR5 898.75±18.43a 920.83±25.83a 934.58±21.34a 882.92±15.48a 888.75±16.39a 910.00±17.72a 922.50±4.39a 877.50±17.72a 耳状幼体6 AUR6 1 038.75±17.02abc 1 051.25±14.20bc 1 067.92±27.85bc 978.75±23.20a 1 051.25±19.62bc 1 068.75±26.53bc 1 105.42±10.21c 1 013.75±26.53ab 注:字母不同表示同一时期不同处理组之间差异显著;*. 同一时期相同处理组不同亲本来源幼体之间差异显著,后表同此
Note:Different letters indicate significant difference among different treatments in the same group. Asterisks indicate significant difference in the same treatment between DA and XP. The same case in the following table.![]() 图 2 不同处理组幼体体长日变化a. 未度夏、霞浦越冬刺参亲本(DA组)繁育后代;b. 已度夏、霞浦越冬刺参亲本(XP组)繁育后代Figure 2. Daily change in body length of larvae among different groupsa and b show the larvae growth of group DA and XP, respectively.
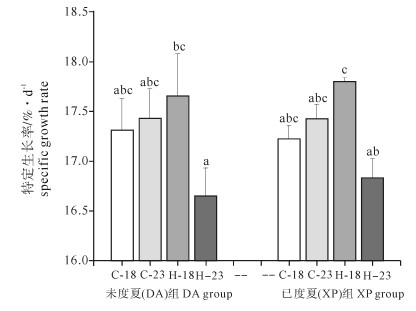
图 2 不同处理组幼体体长日变化a. 未度夏、霞浦越冬刺参亲本(DA组)繁育后代;b. 已度夏、霞浦越冬刺参亲本(XP组)繁育后代Figure 2. Daily change in body length of larvae among different groupsa and b show the larvae growth of group DA and XP, respectively.浮游幼体时期各处理组幼体体长的SGR见图 3。DA和XP组幼体SGR的极值都出现在热应激组(最高值出现在H-18组;最低值出现在H-23组),但各处理组之间差异不显著(F(7, 23)=1.847,P>0.05)。独立样本T检验结果表明DA组和XP组之间差异不显著(P>0.05)。
![]() 图 3 不同处理组体长特定生长率字母不同表示同组不同处理之间差异显著,后图同此Figure 3. Specific growth rate of body length among different groupsDifferent letters indicate significant difference among different treatments in the same group. The same case in the following figures.
图 3 不同处理组体长特定生长率字母不同表示同组不同处理之间差异显著,后图同此Figure 3. Specific growth rate of body length among different groupsDifferent letters indicate significant difference among different treatments in the same group. The same case in the following figures.不同处理组幼体成活率变化见表 2。耳状幼体第1天时热应激组幼体成活率显著下降,与对照组之间差异显著(F(7, 23)=27.109,P < 0.05),其他时期各处理组幼体的成活率没有显著性差异(原肠早期F(7, 23)=0.491,P>0.05;原肠晚期F(7, 23)=0.181,P>0.05;耳状幼体第2天F(7, 23)=0.080,P>0.05;耳状幼体第3天F(7, 23)=0.028,P>0.05;耳状幼体第4天F(7, 23)=0.191,P>0.05;耳状幼体第5天F(7, 23)=0.373,P>0.05;耳状幼体第6天F(7, 23)=1.421,P>0.05)。独立样本T检验结果表明同一时期相同处理组DA组和XP组之间差异不显著(P>0.05)。
表 2 不同组幼体每日成活率变化Table 2. Daily change in survival rate of larvae among different groups未度夏(DA)组DA group 已度夏(XP)组XP group C-18 C-23 H-18 H-23 C-18 C-23 H-18 H-23 原肠早期early-GAS 90.00±0.00a 93.33±3.33a 86.67±3.33a 90.00±5.77a 90.00±5.77a 96.67±3.33a 86.67±8.82a 90.00±0.00a 原肠晚期late-GAS 88.89±0.00a 92.59±3.70a 92.59±3.70a 92.96±3.53a 89.63±5.79a 92.96±3.53a 89.63±5.79a 88.89±6.42a 耳状幼体1 AUR1 95.83±4.17b 96.67±3.33b 54.17±4.17a 52.31±5.34a 95.83±4.17b 96.30±3.70b 56.55±3.62a 54.70±5.35a 耳状幼体2 AUR2 95.24±4.76a 96.30±3.70a 93.33±6.67a 91.67±8.33a 91.07±4.49a 93.33±6.66a 93.33±6.66a 91.67±8.33a 耳状幼体3 AUR3 90.28±5.00a 91.67±4.17a 91.67±8.33a 93.33±6.67a 91.07±4.49a 91.67±4.17a 91.67±8.33a 93.33±6.67a 耳状幼体4 AUR4 86.31±8.27a 91.07±4.49a 83.33±8.33a 91.67±8.33a 90.48±13.54a 91.07±4.49a 83.33±8.33a 91.67±8.33a 耳状幼体5 AUR5 83.81±8.46a 85.71±8.25a 88.89±11.11a 91.67±8.33a 81.90±1.90a 90.48±4.76a 77.78±11.11a 91.67±8.33a 耳状幼体6 AUR6 85.00±7.64a 87.78±6.19a 61.11±5.56a 77.78±11.11a 80.56±10.02a 83.33±9.62a 88.89±11.11a 66.67±0.00a 2.2 亲本驯化和囊胚期高温应激对刺参浮游幼体变态率的影响
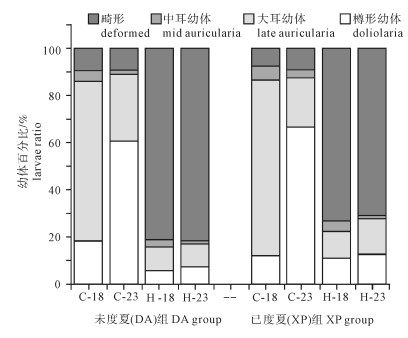
第9天各处理组都出现樽形幼体,此时对不同处理组幼体发育情况进行了统计(图 4)。23 ℃培育下的对照组都有较高的樽形幼体比例(DA组60.67%;XP组66.33%),不同组之间差异显著(F(7, 23)=114.344,P < 0.05)。热应激组的畸形率较高(DA组,H-18为81%, H-23为81.67%;XP组,H-18为73.33%,H-23为71%),不同处理组之间差异显著(F(7, 23)=165.925,P < 0.05)。独立样本T检验结果表明相同处理组DA组和XP组之间差异不显著(P>0.05)。
![]() 图 4 第9天时不同处理组幼体发育情况Figure 4. Percentages of mid- and late-stage auricularia, doliolaria and deformed larvae of sea cucumber on 9th day among different groups
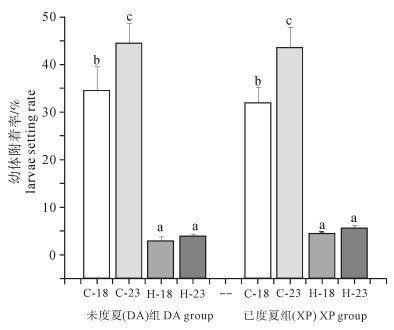
图 4 第9天时不同处理组幼体发育情况Figure 4. Percentages of mid- and late-stage auricularia, doliolaria and deformed larvae of sea cucumber on 9th day among different groups不同处理组幼体附着变态率见图 5。23 ℃培育下的对照组都有较高的附着变态率(DA组44.33%,XP组43.50%),对照组较热应激组具有
较高的附着变态率,且各组之间差异显著(F(7, 23)=36.042,P < 0.05),但是相同处理组DA组和XP组之间差异不显著(P>0.05)。
3. 讨论
刺参属于冷温性动物,对高温的耐受能力比较差,由于霞浦夏季的水温要显著高于胶南(图 1),因此XP组亲本的死亡率高于DA组。温度能够影响变温动物幼体的生长和发育[18-20]。一般来讲低温下的生长率会低于高温下的生长率。该研究中对照组18 ℃培育下的幼体的SGR要低于23 ℃培育下的幼体。幼体在浮游时期的成活率也有相同的趋势。ASHA和MUTHIAH[21]在研究温度对尖塔海参(Holothuria spinifera)生长和成活影响时也得到了相似的结果。幼虫在低温时生长缓慢是由于体内的酶不活跃所致,从而导致幼体过长时间处于危险的浮游时期,增加了死亡率[22-23]。但是培育温度对热应激组幼体的发育有不同的影响,18 ℃培育下的幼体的SGR要高于23 ℃培育下的幼体,且差异显著(P < 0.05)。这种现象可能的原因是囊胚期热应激改变了幼体对温度的需求,尽管之前的研究表明浮游期热应激能够提高变态后幼参的热耐受性[12],但是有关热应激对浮游期幼体生长、代谢以及温度耐受性的影响尚需进一步研究。从耳状幼体第2天开始,DA组和XP组幼体的最大体长出现在热应激组,而在原肠期和耳状幼体第1天对照组幼体具有最大体长(表 1)。这与幼体对饵料的摄取有关,在原肠晚期刺参浮游幼体开始摄食,在此之前靠卵黄积累的能量维持机体代谢。高温应激能诱导机体产生热休克蛋白来修复和清除受损伤蛋白,但是热休克蛋白功能的发挥需要消耗大量的能量。因此幼体开口之前,热应激组幼体用于生长的能量减少,导致体长小于对照组个体。但是幼体开口以后,随着对外界营养的摄取,热激组幼体出现补偿生长现象。
温度能够影响海洋无脊椎动物幼体的发育速度和附着变态[24-26]。一般来讲,在适宜温度范围内,较高的温度有利于幼体的发育和变态,原因在于适宜的较高温度有利于幼体获取食物,补充机体代谢所需能量[27-28]。该研究中第9天时对照组23 ℃培育下樽形幼体比例要显著高于18 ℃组,23 ℃培育下幼体的附着变态率要高于18 ℃组,而且热应激组的附着变态率要显著低于对照组(P < 0.05)(图 5)。之前的研究结果表明,浮游时期高温应激会导致幼体畸形率升高[10],畸形的幼体不能完成变态,导致变态率降低。在耳状幼体第1天时热应激组幼体出现大规模的死亡(表 2)。这是导致热应激组附着变态率降低的一个重要原因。
之前的研究表明囊胚期进行高温应激能够提高变态后幼参的耐热性[12],但是相比对照组,热应激组幼体的附着变态率太低(约5%),因此不能用于大规模生产。据观测,2012年霞浦县水温要高于胶南水温(图 1),因此,XP组刺参亲本经历的温度要高于DA组,相对DA组个体XP组刺参亲本经历了高温驯化。通过比较不同驯化历史亲本浮游幼体的生长、成活以及附着变态率,发现DA组和XP组幼体各指标之间差异不显著(P>0.05),即刺参亲本高温驯化不会影响浮游幼体生长、成活和附着变态率。鉴于亲本高温驯化所获得的对高温耐受能力的可遗传性[14-17],研究人员可以通过囊胚期高温应激获取一定数量的耐高温幼参,然后在南方进行幼体培育和中间养成,待其性成熟后进行苗种繁育,经过累代选育固定耐高温性状,最终达到获取耐高温刺参苗种的目的。通过几年的摸索,目前课题组已经获取一批性成熟个体,计划今年进行苗种繁育,后续实验有待于进一步研究。
-
![]()
图 1 2012年霞浦和胶南全年日均水温对比
Figure 1. Comparison of daily water temperature of Xiapu and Jiaonan in 2012
![]()
图 2 不同处理组幼体体长日变化
a. 未度夏、霞浦越冬刺参亲本(DA组)繁育后代;b. 已度夏、霞浦越冬刺参亲本(XP组)繁育后代
Figure 2. Daily change in body length of larvae among different groups
a and b show the larvae growth of group DA and XP, respectively.
![]()
图 3 不同处理组体长特定生长率
字母不同表示同组不同处理之间差异显著,后图同此
Figure 3. Specific growth rate of body length among different groups
Different letters indicate significant difference among different treatments in the same group. The same case in the following figures.
![]()
图 4 第9天时不同处理组幼体发育情况
Figure 4. Percentages of mid- and late-stage auricularia, doliolaria and deformed larvae of sea cucumber on 9th day among different groups
表 1 不同处理组幼体体长日变化
Table 1 Daily change in body length of larvae among different groups
未度夏(DA)组DA group 已度夏(XP)组XP group C-18 C-23 H-18 H-23 C-18 C-23 H-18 H-23 囊胚期BLA 219.00±4.16a 219.00±4.16a 219.00±4.16a 219.00±4.16a 223.00±2.18a 223.00±2.18a 223.00±2.18a 223.00±2.18a 原肠早期early-GAS 359.00±4.54a 472.92±7.23b 372.17±7.17a 373.17±55.93a 456.25±8.20b* 510.00±9.02b 458.75±1.25b* 506.67±9.02b* 原肠晚期late-GAS 544.17±7.26a 609.58±5.22b 546.67±10.52a 601.25±6.17b 598.75±16.88b* 656.67±9.92c* 592.92±16.68b* 613.75±9.92b 耳状幼体1 AUR1 650.00±4.02b* 662.08±1.82b 650.83±7.92b 651.25±6.17b 620.00±7.64a 673.75±3.31b 653.75±14.81b 657.50±3.31b 耳状幼体2 AUR2 682.92±6.55a 712.92±3.97ab 724.17±25.43ab 751.25±14.42b* 714.58±10.86ab 710.00±15.88ab 726.67±13.35ab 699.17±15.88a 耳状幼体3 AUR3 750.83±18.74a 774.58±17.22ab 766.67±2.20ab 780.83±14.51ab 787.92±9.82ab 779.17±12.83ab 801.67±8.61b 766.25±12.83ab 耳状幼体4 AUR4 807.92±4.35a 831.67±4.70abc 846.67±18.62abc 828.75±24.25ab 845.83±13.72abc 860.00±15.68bc 877.50±12.27c 820.83±15.68ab 耳状幼体5 AUR5 898.75±18.43a 920.83±25.83a 934.58±21.34a 882.92±15.48a 888.75±16.39a 910.00±17.72a 922.50±4.39a 877.50±17.72a 耳状幼体6 AUR6 1 038.75±17.02abc 1 051.25±14.20bc 1 067.92±27.85bc 978.75±23.20a 1 051.25±19.62bc 1 068.75±26.53bc 1 105.42±10.21c 1 013.75±26.53ab 注:字母不同表示同一时期不同处理组之间差异显著;*. 同一时期相同处理组不同亲本来源幼体之间差异显著,后表同此
Note:Different letters indicate significant difference among different treatments in the same group. Asterisks indicate significant difference in the same treatment between DA and XP. The same case in the following table. 下载: 导出CSV
表 2 不同组幼体每日成活率变化
Table 2 Daily change in survival rate of larvae among different groups
未度夏(DA)组DA group 已度夏(XP)组XP group C-18 C-23 H-18 H-23 C-18 C-23 H-18 H-23 原肠早期early-GAS 90.00±0.00a 93.33±3.33a 86.67±3.33a 90.00±5.77a 90.00±5.77a 96.67±3.33a 86.67±8.82a 90.00±0.00a 原肠晚期late-GAS 88.89±0.00a 92.59±3.70a 92.59±3.70a 92.96±3.53a 89.63±5.79a 92.96±3.53a 89.63±5.79a 88.89±6.42a 耳状幼体1 AUR1 95.83±4.17b 96.67±3.33b 54.17±4.17a 52.31±5.34a 95.83±4.17b 96.30±3.70b 56.55±3.62a 54.70±5.35a 耳状幼体2 AUR2 95.24±4.76a 96.30±3.70a 93.33±6.67a 91.67±8.33a 91.07±4.49a 93.33±6.66a 93.33±6.66a 91.67±8.33a 耳状幼体3 AUR3 90.28±5.00a 91.67±4.17a 91.67±8.33a 93.33±6.67a 91.07±4.49a 91.67±4.17a 91.67±8.33a 93.33±6.67a 耳状幼体4 AUR4 86.31±8.27a 91.07±4.49a 83.33±8.33a 91.67±8.33a 90.48±13.54a 91.07±4.49a 83.33±8.33a 91.67±8.33a 耳状幼体5 AUR5 83.81±8.46a 85.71±8.25a 88.89±11.11a 91.67±8.33a 81.90±1.90a 90.48±4.76a 77.78±11.11a 91.67±8.33a 耳状幼体6 AUR6 85.00±7.64a 87.78±6.19a 61.11±5.56a 77.78±11.11a 80.56±10.02a 83.33±9.62a 88.89±11.11a 66.67±0.00a
下载: 导出CSV
-
[1] STROBEL A, BENNECKE S, LEO E, et al. Metabolic shifts in the Antarctic fish Notothenia rossii in response to rising temperature and PCO2[J]. Front Zool, 2012, 9(1): 28-28. doi: 10.1186/1742-9994-9-28
[2] MADEIRA D, NARCISO L, CABRAL H N, et al. Thermal tolerance and potential impacts of climate change on coastal and estuarine organisms[J]. J Sea Res, 2012, 70(1): 32-41. doi: 10.1016/J.SEARES.2012.03.002
[3] DAS T, PALA A K, CHAKRABORTYB S K, et al. Thermal tolerance and oxygen consumption of Indian major carps acclimated to four temperatures[J]. J Therm Biol, 2004, 29(3): 157-163. doi: 10.1016/j.jtherbio.2004.02.001
[4] AKHTAR M S, PAL A K, SAHU N P, et al. Thermal tolerance, oxygen consumption and haemato-biochemical variables of Tor putitora juveniles acclimated to five temperatures[J]. Fish Physiol Biochem, 2013, 39(6): 1387-1398. doi: 10.1007/s10695-013-9793-7
[5] 柴学军, 孙敏, 许源剑. 温度和盐度对日本黄姑鱼胚胎发育的影响[J]. 南方水产科学, 2011, 7(5): 43-49. doi: 10.3969/j.issn.2095-0780.2011.05.007 [6] 刘永新, 周勤, 张红涛, 等. 温度对红鳍东方鲀早期生长和性别分化的影响[J]. 南方水产科学, 2014, 10(5): 24-29. doi: 10.3969/j.issn.2095-0780.2014.05.004 [7] 梁俊平, 李健, 李吉涛, 等. 不同温度对脊尾白虾胚胎发育与幼体变态存活的影响[J]. 生态学报, 2013, 33(4): 1142-1152. doi: 10.5846/stxb201204070485 [8] 栗治国, 张成松, 张岩, 等. 温度对脊尾白虾胚胎及幼体发育的影响研究[J]. 海洋科学, 2013, 37(10): 9. https://www.cnki.com.cn/Article/CJFDTotal-HYKX201310002.htm [9] 王国善, 于志刚, 米铁柱, 等. 环境因子对海蜇生长发育影响的研究进展[J]. 海洋科学, 2014, 38(1): 85. [10] 王青林, 董云伟, 董双林, 等. 高温刺激对刺参浮游期幼体存活率及Hsp70表达量的影响[J]. 中国海洋大学学报: 自然科学版, 2011, 41(3): 47-51. doi: 10.3969/j.issn.1672-5174.2011.03.008 [11] MENG X L, JI T T, DONG Y W, et al. Thermal resistance in sea cucumbers (Apostichopus japonicus) with differing thermal history: the role of Hsp70[J]. Aquaculture, 2009, 294(3/4): 314-318. doi: 10.1016/j.aquaculture.2009.06.015
[12] WANG Q L, DONG Y W, DONG S L, et al. Effects of heat-shock selection during pelagic stages on thermal sensitivity of juvenile sea cucumber, Apostichopus japonicus Selenka[J]. Aquac Int, 2011, 19(6): 1165-1175. doi: 10.1007/s10499-011-9436-x
[13] WANG Q L, DONG Y W, QIN C X, et al. Effects of rearing temperature on growth, metabolism and thermal tolerance of juvenile sea cucumber, Apostichopus japonicus Selenka: critical thermal maximum (CTmax) and hsps gene expression[J]. Aquac Res, 2013, 44(10): 1550-1559. doi: 10.1111/j.1365-2109.2012.03162.x
[14] ESTERHUIZEN N, CLUSELLA-TRULLAS S, van DAALEN C E, et al. Effects of within-generation thermal history on the flight performance of Ceratitis capitata: colder is better[J]. J Exp Biol, 2014, 217(19): 3545-3556. doi: 10.1242/jeb.106526
[15] ZIZZARI Z V, ELLERS J. Rapid shift in thermal resistance between generations through maternal heat exposure[J]. Oikos, 2014, 123(11): 1365-1370. doi: 10.1111/oik.01496
[16] GILCHRIST G W, HUEY R B. Parental and developmental temperature effects on the thermal dependence of fitness in Drosophila melanogaster[J]. Evolution, 2001, 55(1): 209-214.
[17] FERRER A, MAZZI D, DORN S. Stay cool, travel far: cold-acclimated oriental fruit moth females have enhanced flight performance but lay fewer eggs[J]. Entomologia Experimentalis et Applicata, 2014, 151(1): 11-18. doi: 10.1111/eea.12163
[18] 高绪生, 孙勉英. 温度对光棘球海胆不同发育阶段的影响[J]. 海洋与湖沼, 1993, 24(6): 634-640. doi: 10.3321/j.issn:0029-814X.1993.06.012 [19] LI L, LI Q. Effects of stocking density, temperature, and salinity on larval survival and growth of the red race of the sea cucumber Apostichopus japonicus (Selenka)[J]. Aquac Int, 2010, 18(3): 447-460. doi: 10.1007/s10499-009-9256-4
[20] 韩晓磊, 李小蕊, 程东成, 等. 温度对克氏原螯虾交配, 抱卵, 孵化和幼体生长发育的影响[J]. 湖北农业科学, 2011, 50(10): 2078-2080. doi: 10.3969/j.issn.0439-8114.2011.10.040 [21] ASHA P S, MUTHIAH P. Spawning and larval rearing of the sea cucumber Holothuria (Theelothuria) spinifera Theel[J]. SPC Beche-de-mer Inf Bull, 2002, 16(9): 11-15. https://xueshu.baidu.com/usercenter/paper/show?paperid=a8b032e6a48cdf4ffb7e9418ae3180d8&site=xueshu_se
[22] LOOSANOFF V L, DAVIS H C. Rearing of bivalve mollusks[J]. Adv Mar Biol, 1963, 1: 1-136. doi: 10.1016/S0065-2881(08)60257-6
[23] LI L, LI Q, SUN X J, et al. Effects of temperature and salinity on larval growth, survival, and development of the sea cucumber Apostichopus japonicas[J]. N Am J Aquacult, 2011, 73(3): 296-303. doi: 10.1080/15222055.2011.598373
[24] 蒲利云, 陈傅晓, 曾关琼, 等. 温度和盐度对古蚶幼虫发育的影响[J]. 热带生物学报, 2012, 3(2): 177-179. doi: 10.3969/j.issn.1674-7054.2012.02.018 [25] 柯才焕, 郑怀平, 周时强, 等. 温度对波部东风螺幼虫存活、生长和变态的影响[M]//贝类学论文集第Ⅸ集. 北京: 海洋出版社, 2001: 70-76. https://xueshu.baidu.com/usercenter/paper/show?paperid=1m0m0cg0qg3j0t60ba6h0xu0k4773904&site=xueshu_se&hitarticle=1 [26] 李莉. 中国青刺参和日本红刺参苗种培育的生物学研究[D]. 青岛: 中国海洋大学, 2009: 23. 10.7666/d.y1503941 [27] 兰国宝, 廖思明, 阎冰. 水温对方格星虫幼体发育及变态的影响[J]. 水产学报, 2007, 31(5): 633-638. doi: 10.3321/j.issn:1000-0615.2007.05.010 [28] RICO-VILLA B, POUVREAU S, ROBERT R. Influence of food density and temperature on ingestion, growth and settlement of Pacific oyster larvae, Crassostrea gigas[J]. Aquaculture, 2009, 287(3): 395-401. https://www.semanticscholar.org/paper/Influence-of-food-density-and-temperature-on-%2C-and-Rico-Villaa-Pouvreaua/d3e1e1c838671918063e0947d3048b392e6d3473
-
期刊类型引用(4)
1. 朱轩仪,郑晓婷,邢逸夫,黄建华,董宏标,张家松. 三丁酸甘油酯提高凡纳滨对虾鳃组织抗周期性高温胁迫能力的研究. 南方水产科学. 2024(03): 66-75 .  本站查看
本站查看
2. 刘蕊,张云岭,张秀文,牛天,宋凯,齐遵利. 刺参良种健康苗种繁育技术. 水产养殖. 2024(07): 59-61 . 百度学术
3. 侯润,张云岭,张秀文,安鑫龙,赵祺,韩宗奇,牛天,齐遵利. 刺参工厂化苗种繁育与生态保苗技术. 河北渔业. 2023(03): 8-13 . 百度学术
4. 赵斌,胡炜,李成林,韩莎. 温度和盐度对紫刺参(Apostichopus japonicus Selenta)稚参存活、生长和着色的影响. 海洋与湖沼. 2018(03): 700-706 . 百度学术
其他类型引用(0)
计量
- 文章访问数: 3287
- HTML全文浏览量: 169
- PDF下载量: 1342
- 被引次数: 4
 粤公网安备 44010502001741号
