
Study of impacts of environmental factors on stock and recruitment relationship of the anchovy stock in the Yellow Sea
-
摘要:
鱼类年际资源量的波动可以归因于年间环境条件的变化和该种鱼类亲体数量的变化。文章根据1990~2001年间黄海中南部鳀鱼声学调查评估结果,以及黄海千里岩海区在此年间的表层水温和营养盐统计数据,以Ricker模型(R=αSe-βS)为基础对黄海鳀鱼(Engraulis japonicas)亲体-补充量关系进行了初步研究。结果表明,黄海千里岩水域表层水温、磷酸盐浓度等环境条件因素对补充量有重要影响。
Abstract:Changes in fish year-class strength have been attributed to year-to-year variability in environmental conditions, such as sea surface temperature (SST) and phosphate concentration, and spawning stock biomass(SSB).In this study, we examined the relationship between environmental factors, SSB and recruitment for the anchovy (Engraulis japonicas) stock in the Yellow Sea using a traditional stock-recruitment Ricker model. The recruitment fluctuation of the anchovy stock in the Yellow Sea was successfully reproduced by the Ricker stock-recruitment model with environmental factors. The findings suggest that the impacts of SST and phosphate concentration observed at the Qianliyan Marine Environment Monitoring Station in the Yellow Sea on the anchovy stock in the Yellow Sea are very important.
-
Keywords:
- stock-recruitment model /
- environmental condition index /
- AIC /
- BIC
-
近年来,凡纳滨对虾的集约化养殖规模日益扩大,与此同时,病害发生也日趋严重,给水产业者造成了严重损失。微生态制剂又称微生态调节剂或益生菌,大量的研究证实了微生态制剂能够改善食物的性能,提高人体的健康水平[1]。益生菌具有很强的抗病、抗炎症和抗过敏效力[2]。适宜的微生态制剂能够调节肠道微生物的平衡,从而改善食物的吸收,抑制胃肠道中的致病菌[1]。
随着微生物学和微生态学的深入研究,利用微生态制剂来调节动物体内的微生态平衡,恢复机体正常生理功能、防治病害、增进健康等方面的研究和应用越来越广泛[3]。微生态制剂掺入饲料或通过饮水进入动物肠道后,可以与肠道内有益菌一起,形成强有力的优势菌群,抑制或消灭致病菌群,调整和提高动物机体各器官功能,产生免疫、生长刺激等多种作用,提高动物的消化能力,促进动物生长。此研究探讨了益生菌对凡纳滨对虾生长和全虾营养组成的影响。
1. 材料和方法
1.1 试验用虾及试验条件
试验用虾为中国水产科学研究院南海水产研究所热带水产研究开发中心(三亚)培育的虾苗,在盐度为30条件下暂养,完全适应后挑选健康且大小均匀的凡纳滨对虾,于室外水泥池(0.95 m×0.60 m×1.0 m)分组进行试验,在水泥池上方1.5 m处遮盖黑色遮阳布。养殖水经沉淀后过滤。每池养虾40尾,每组饲料3个平行。
1.2 试验饲料的配制
试验饲料1、饲料2、饲料3、饲料4、饲料5、饲料6和饲料7中益生菌的添加量分别为0,0.5,1.0,1.5,2.0,2.5和3.0 g · kg-1,采用麸皮替代益生菌来平衡各组在添加量上的差异。益生菌(Bacillus sp.,109 CFU ·g-1)为南海水产研究所饲料与健康养殖开发中心的产品。饲料原料粉混匀后加40%自来水搅拌均匀,制成粒径1.0 mm的颗粒,晒干后于-20℃冰箱中保存备用。营养组成见表 1。
表 1 饲料营养组成Table 1. Proximate composition of the experimental diets% 饲料1
diet 1饲料2
diet 2饲料3
diet 3饲料4
diet 4饲料5
diet 5饲料6
diet 6饲料7
diet 7水分 moisture 7.45 6.98 7.49 7.56 7.34 7.65 7.89 粗蛋白 crude protein 43.72 43.04 42.33 43.09 43.18 43.04 42.44 粗脂肪 crude lipid 4.52 4.30 4.02 4.71 4.18 4.43 4.24 灰分 crude ash 15.86 16.79 16.32 16.12 16.00 16.11 15.97 1.3 饲养管理
每个池中放一个投料台,便于观察对虾的摄食情况。每天分3次投料,08: 00、17: 00和22: 00,投料量约为虾重的5%~8%,并根据摄食情况调节投喂量。试验过程每天换水量约为1/3。养殖全程不进行水体消毒,不投喂任何药物。
1.4 结果计算及数据统计分析
试验进行8周后对所有虾称重,试验参数的计算公式如下:
$$ \begin{array}{l} 增重率(\% ) = 100 \times \left( {{W_{\rm{t}}} - {W_0}} \right)/{W_0}\\ {\rm{饲料系数FCR}} = F/\left( {{W_{\rm{t}}} - {W_0}} \right)\\ {\rm{蛋白质效率PER}} = \left( {{W_{\rm{t}}} - {W_0}} \right)/(F \times P) \end{array} $$ Wt、W0分别为终末和初始虾体平均湿重,F为摄入饲料重量,P为饲料蛋白质含量。
试验结果采用平均数±标准差表示和Duncan′s多重比较法分析平均数的差异显著性(P<0.05)。
2. 结果
2.1 益生菌对生长、成活率和饲料利用的影响
经8周的养殖试验,凡纳滨对虾的成活率、增重、饲料系数和蛋白质转化率见表 2。饲料中添加益生菌,对凡纳滨对虾的成活率没有显著影响。添加益生菌1.0和1.5 g · kg-1饲料,凡纳滨对虾的增重率高并且饲料系数低于对照组,特别是添加益生菌1.0 g · kg-1时,差异显著;然而,其它添加量与对照组相比不存在显著性差异。蛋白质转化率与饲料系数具有相似的趋势。
表 2 添加不同剂量益生菌对凡纳滨对虾生长和饲料利用的影响Table 2. Effects of dietary probiotics on growth and feed utilization of L.vannamei饲料1
diet 1饲料2
diet 2饲料3
diet 3饲料4
diet 4饲料5
diet 5饲料6
diet 6饲料7
diet 7开始体重/g·尾-1
initial weight0.03 0.03 0.03 0.03 0.03 0.03 0.03 结束体重/g·尾-1
final weight1.75±0.05 1.79±0.06 1.89±0.07 1.88±0.01 1.78±0.08 1.67±0.10 1.76±0.09 增重率/%
weight gain5 725±179ab 5 857±207abc 6 190±219c 6 159±24bc 5 834±274abc 5 478±330a 5 771±297abc 成活率/%
survial94.44±2.55 97.22±2.55 95.56±3.85 97.22±2.55 95.00±7.26 96.67±2.89 94.44±6.94 饲料系数
feed conversion ratio1.44±0.06bc 1.34±0.04abc 1.30±0.02a 1.30±0.03a 1.45±0.06c 1.45±0.09bc 1.44±0.11bc 蛋白质效率
protein efficiency ratio1.59±0.07a 1.73±0.06abc 1.80±0.03c 1.79±0.04bc 1.65±0.05ab 1.61±0.08a 1.65±0.13ab 注:同行数据(平均数±SD)没有上标字母或上标字母相同的表示不存在显著差异(P>0.05)
Note:Means within rows without superscript or with the same superscript are not significantly different(P>0.05).2.2 益生菌对全虾营养和氨基酸组成的影响
凡纳滨对虾全虾营养组成见表 3。添加益生菌对凡纳滨对虾全虾的水分、蛋白质和灰分含量影响不显著。投喂添加益生菌的饲料与对照组相比,凡纳滨对虾的脂肪含量没有显著性差异。但投喂添加益生菌1.0 g · kg-1饲料,脂肪含量显著高于0.5、2.5和3.0 g · kg-1饲料,与其它饲料没有显著性差异。
表 3 添加不同剂量益生菌对凡纳滨对虾全虾营养成分的影响Table 3. Effects of dietary probiotics on nutritional composition of whole L.vannamei饲料1
diet 1饲料2
diet 2饲料3
diet 3饲料4
diet 4饲料5
diet 5饲料6
diet 6饲料7
diet 7水分 moisture 76.37±0.75 76.63±0.62 75.76±1.28 76.42±1.28 77.07±0.83 77.05±0.09 76.82±0.17 粗蛋白 crude protein 15.70±0.48 15.91±0.39 15.57±0.75 16.41±0.89 15.41±0.56 15.69±0.28 15.74±0.38 粗脂肪 crude lipid 2.07±0.32ab 1.86±0.13a 2.45±0.07b 2.25±0.18ab 2.04±0.28ab 1.98±0.37a 1.90±0.22a 灰分 crude ash 3.22±0.12 3.24±0.20 3.27±0.12 3.36±0.22 3.32±0.05 3.33±0.13 3.41±0.10 注:同行数据(平均数±SD)没有上标字母或上标字母相同的表示不存在显著差异(P>0.05)
Note:Means within rows without superscript or with the same superscript are not significantly different(P>0.05).凡纳滨对虾全虾氨基酸组成见表 4。投喂不同剂量的益生菌对凡纳滨对虾全虾的异亮氨酸、亮氨酸、门冬氨酸、甘氨酸、胱氨酸、必需氨基酸总量和非必需氨基酸总量没有显著影响。添加益生菌的对虾全虾苏氨酸、蛋氨酸、苯丙氨酸、组氨酸、丝氨酸和脯氨酸呈上升的趋势,而缬氨酸、赖氨酸、精氨酸、谷氨酸和丙氨酸则呈下降趋势。结果表明,添加益生菌可以改变凡纳滨对虾全虾中部分氨基酸组成。
表 4 添加不同剂量益生菌对凡纳滨对虾全虾氨基酸组成的影响Table 4. Effects of dietary probiotics on amino acids composition of whole L.vannamei氨基酸
amino acids饲料1
diet 1饲料2
diet 2饲料3
diet 3饲料4
diet 4饲料5
diet 5饲料6
diet 6饲料7
diet 7苏氨酸 Threonine 3.48±0.11a 3.43±0.05a 3.72±0.06b 3.74±0.12b 3.66±0.05b 3.70±0.02b 3.63±0.02b 缬氨酸 Valine 5.37±0.08bc 5.39±0.06c 5.26±0.01abc 5.20±0.08a 5.22±0.11ab 5.26±0.04abc 5.30±0.12abc 蛋氨酸 Methionine 2.58±0.10a 2.71±0.07ab 2.80±0.01b 2.85±0.16bc 2.80±0.14b 3.00±0.08cd 3.07±0.10d 异亮氨酸 Isoleucine 4.55±0.15 4.63±0.03 4.64±0.03 4.50±0.05 4.51±0.08 4.53±0.06 4.57±0.11 亮氨酸 Leucine 7.75±0.19 7.88±0.05 7.55±0.39 7.64±0.05 7.56±0.09 7.54±0.04 7.52±0.18 苯丙氨酸 Phenyalanine 4.50±0.14ab 4.64±0.07abc 4.61±0.06abc 4.40±0.19a 4.72±0.18bc 4.65±0.06abc 4.77±0.14c 赖氨酸 Lysine 7.28±0.08d 7.26±0.02d 7.16±0.06cd 6.92±0.07a 6.94±0.02ab 6.96±0.08ab 7.08±0.16bc 组氨酸 Histidine 1.74±0.07ab 1.74±0.06ab 1.71±0.07a 1.83±0.03bc 1.89±0.03c 1.85±0.08bc 1.84±0.06bc 精氨酸 Arginie 8.63±0.05c 8.25±0.55abc 8.51±0.07bc 8.08±0.14ab 7.88±0.23a 8.07±0.32ab 8.00±0.15ab 必需氨基酸
Essential amino acids45.88±0.70 45.92±0.81 45.96±0.59 45.17±0.37 45.18±0.23 45.57±0.25 45.78±0.93 门冬氨酸 Aspartic acid 9.97±0.20 9.89±0.18 9.81±0.16 9.92±0.10 9.82±0.04 9.89±0.09 9.82±0.18 丝氨酸 Serine 2.73±0.18a 2.62±0.09a 3.22±0.07b 3.17±0.11b 3.10±0.01b 3.17±0.01b 3.08±0.07b 谷氨酸 Glutamic acid 14.81±0.25b 14.84±0.20b 14.67±0.08ab 14.74±0.11b 14.42±0.03a 14.45±0.02a 14.46±0.32a 脯氨酸 Proline 5.49±0.15ab 5.46±0.13ab 5.41±0.05a 6.19±0.38bc 6.62±0.50d 6.14±0.11c 6.26±0.10cd 甘氨酸 Glycine 8.37±0.20 8.61±0.02 8.58±0.26 8.72±0.29 8.49±0.29 8.67±0.13 8.70±0.32 丙氨酸 Alanine 7.07±0.07b 7.05±0.05b 6.92±0.06ab 6.93±0.06ab 6.77±0.11a 6.77±0.10a 6.77±0.18a 胱氨酸 Cystine 0.58±0.00 0.63±0.06 0.68±0.07 0.58±0.16 0.64±0.18 0.69±0.04 0.69±0.03 酪氨酸 Tyrosine 3.23±0.18b 3.02±0.05ab 3.10±0.06ab 3.11±0.20b 3.08±0.02ab 2.97±0.05a 2.94±1.05a 非必需氨基酸
Non-essential amino acids52.24±0.48 52.11±0.48 52.38±0.28 53.36±0.58 52.94±0.41 52.76±0.10 53.33±1.44 注:同行数据(平均数±SD)没有上标字母或上标字母相同的表示不存在显著差异(P>0.05)
Note:Means within rows without superscript or with the same superscript are not significantly different(P>0.05).3. 讨论
在水产养殖中,随着对养殖环境改良的迫切要求,益生菌在水产动物的应用研究越来越受到人们的关注[4]。由于水产动物生活在水中,水在消化道中传递,使得鱼虾肠胃中的微生物取决于外界的水环境[5-7],细菌从水和饲料中不断进入体内,其中大多数能在肠道中逗留。有些益生菌并不添加于饲料中,而是作为水质改良剂[4]。
益生菌在各种不同的水产动物养殖中有一定的作用效果。RENGPIPAT等[8]报道投喂益生菌株Bacillus S11的斑节对虾Penaeus monodon吞噬细胞水平明显提高,在遭受病原菌袭击时,成活率显著高于对照组;此外,投喂添加益生菌饲料的斑节对虾的生长和成活率显著高于对照组[1]。在其它虾类,如中国对虾P.chinensis[9-10]和凡纳滨对虾[11-13]也有相似的作用。益生菌除了对对虾类有作用之外,对大西洋鳕Gadus morhua[14]、牙鲆Paralichthys olivaceus[15]、鲤Cyprinus carpio[16]、鳗鲡Anguilla anguilla[17]、石斑鱼Epinephelus coioides[18]以及牡蛎Crasostrea gigas[19]也有显著的促生长作用。然而,GILDBERGET等[20]的研究也显示,在饲料中添加杀鲑气单胞菌Aeromonas salmonicida,对于大西洋鲑Salmo salar鱼苗的生长与存活率并没有明显的差异。
饲料添加适量芽孢杆菌制剂能够促进凡纳滨对虾的生长并提高饲料的利用率。此结果与研究鲤[21]、对虾[22-23]和异育银鲫Allogynogenetic crucian[24]等的结果相似。水生动物消化道内微生物菌群的存在及它们与宿主之间的平衡,保证了宿主正常的代谢,为机体的生长发育提供了丰富的营养物质,也促进了消化道内多种氨基酸、维生素等一系列营养成分的有效合成和吸收利用,从而促进机体生长发育[25]。芽孢杆菌Bacillus sp.可以提高凡纳滨对虾[26]、异育银鲫[27]和鲤鱼[21, 28]消化酶活性,提高饲料的消化率[29],利于养分的消化吸收并促进生长。此研究的结果表明,芽孢杆菌制剂在饲料中的添加量为1.0~2.0 g · kg-1饲料时,能促进对虾的生长,但饲料中添加过量并不能促进生长,可能会影响肠道有益菌群的生态平衡[24-25]。益生菌影响消化过程,主要是通过提高有益菌的数量、微生物酶的活性、提高食物的消化和利用。益生菌的作用可能受到其自身的特性或其它因素等条件的影响,菌株稳定性和成活率、使用剂量和频率、与其它药物的相互作用、动物的健康和营养状态、年龄和遗传学以及不同种类等可以导致效果的变化[30]。
此研究中添加益生菌对凡纳滨对虾全虾的水分、蛋白质和灰分含量影响不显著。投喂添加微生态制剂的饲料与对照组相比,凡纳滨对虾的脂肪含量没有显著性差异。添加益生菌可以改变凡纳滨对虾全虾中部分氨基酸组成。张庆等[31]认为以芽孢杆菌为主导菌的复合制剂投喂斑节对虾,对虾肉质和体质得到改善,虾体水分降低,粗蛋白和氨基酸含量明显升高。
-
![]()
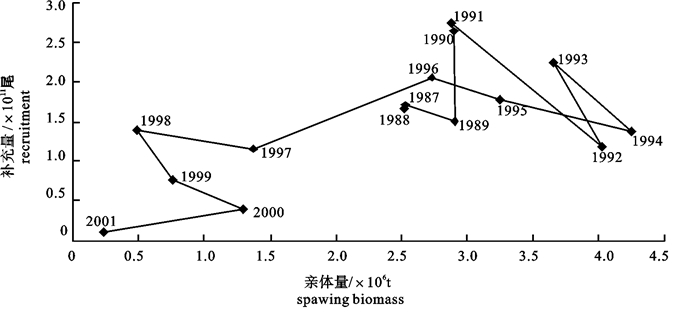
图 1 1987~2001年黄海鳀鱼亲体-补充量数据散点图
图中连线连接相邻年份的补充数据
Figure 1. Scatter plot of the stock and recruitment data for the anchovy (E.japonicas) stock in the Yellow Sea
The line joins recruitment values with the year indicated.
![]()
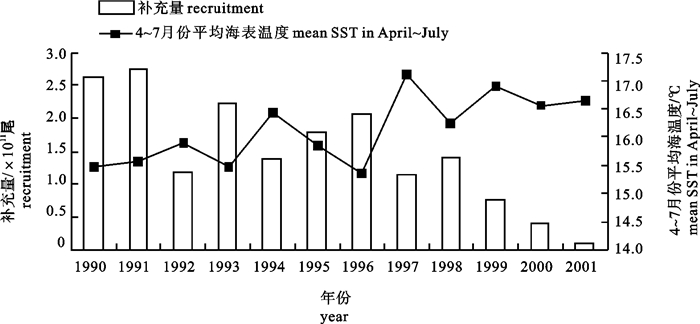
图 2 黄海千里岩1990~2001年4~7月份平均日表层水温数据(折线图)与黄海鳀鱼补充量数据(柱状图)变化趋势图
Figure 2. Variations of mean SST from April to July (line) and recruitment (bar) observed at the Qianliyan Marine Environment Monitoring Station in the Yellow Sea in the period of 1990~2001
![]()
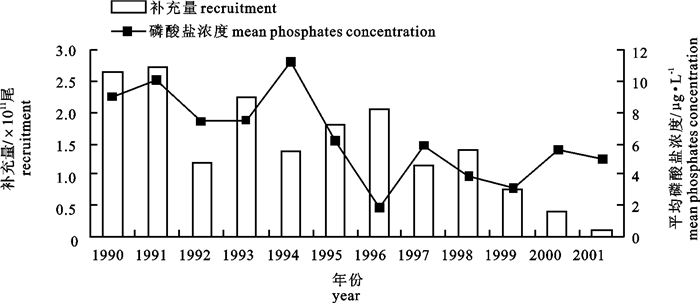
图 3 黄海千里岩1990~2001年平均磷酸盐浓度数据(折线图)与黄海鳀鱼补充量数据(柱状图)变化趋势图
Figure 3. Variations of mean phosphates concentration (line) and recruitment (bar) observed at the Qianliyan Marine Environment Monitoring Station in the Yellow Sea in the period of 1990~2001
![]()
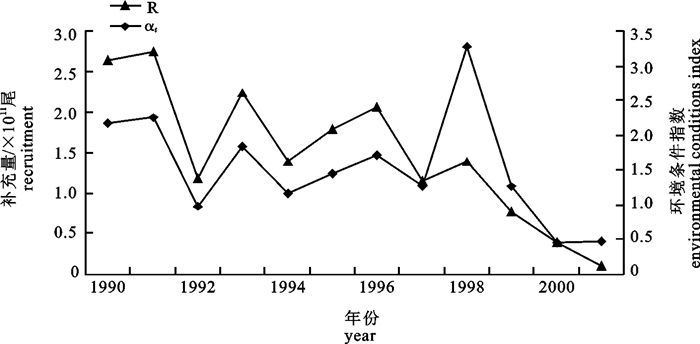
图 4 黄海千里岩环境条件指数αt和黄海鳀鱼补充量指数R变化趋势图
Figure 4. Variations of environmental conditions index and the recruitment observed at the Qianliyan Marine Environment Monitoring Station in the Yellow Sea
![]()
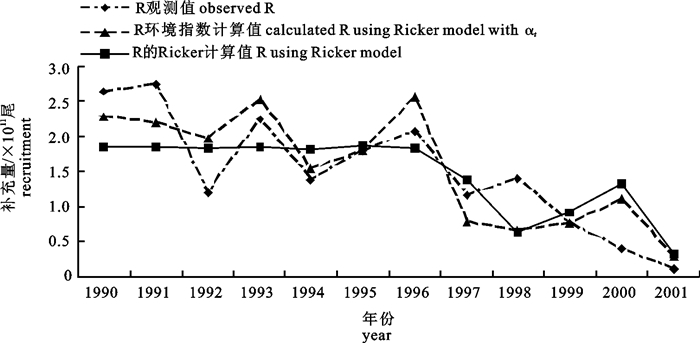
图 5 黄海鳀鱼补充量观测值和计算值比较图
Figure 5. Comparison of observed and calculated recruitment of anchovy (E.japonicas) stock in the Yellow Sea
表 1 黄海千里岩水域环境因子与黄海鳀鱼补充量数据的相关系数
Table 1 The correlation of environmental factors and recruitment data observed at the Qianliyan Marine Environment Monitoring Station in the Yellow Sea
环境因子
environmental factorsXi 相关系数
correlation coefficient年平均磷酸盐浓度
mean phosphates concentrationX1 0.4091 平均表层水温
average sea surface temperature1月 X2 0.2656 2月 X3 0.3707 3月 X4 -0.0761 4月 X5 -0.6213 5月 X6 -0.6614 6月 X7 -0.4987 7月 X8 -0.5290 8月 X9 -0.0451 9月 X10 -0.4223 10月 X11 -0.3174 11月 X12 -0.1593 12月 X13 -0.1838 全年 X14 -0.4679 4~7月 X15 -0.8096  下载: 导出CSV
表 2 黄海鳀鱼SRR模型参数的估计值,AIC、BIC计算值
Table 2 Estimated parameters and AIC, BIC in stock recruitment models (SRR)
模型
model参数 estimated parameters AIC BIC α β α0 α1 α10 α15 Ricker模型
Ricker model1.5931 0.3058 - - - - 37.2062 38.176 加入αt的Ricker模型
Ricker model with αt- 0.3058 7.974 -0.0144 0.216 -0.713 9.3159 11.7404
下载: 导出CSV
-
[1] 张春霖, 成庆泰, 郑傈珊, 等. 黄渤海鱼类调查报告[M]. 北京: 科学出版社, 1955: 51-52. [2] 朱德山, IVERSEN S A. 黄、东海鳀鱼及其他经济鱼类资源声学评估的调查研究[J]. 海洋水产研究, 1990, 11: 18-31. [3] RICKER W E. Computation and interpretation of biological statistics of fish populations[J]. Bull Fish Res Board Can, 1975, 191(18): 1-382. https://www.semanticscholar.org/paper/Computation-and-interpretation-of-biological-of-Ricker/5a8d0d7094c356e3b851fd66bd929ed0e56aabfd
[4] HILBORN R, WALTERS C J. Quantitative fisheries stock assessment: Choice, dynamics and uncertainty[M]. New York: Chapman & Hall, 1992. doi: 10.1007/978-1-4615-3598-0
[5] BEVERTON R J H, HOLT S J. On the dynamics of exploited fish populations[J]. Fish Inverst, 1957, 19(2): 1-533. doi: 10.1007/bf00044132
[6] RICKER W E. Stock and recruitment[J]. J Fish Res Bd Can, 1954, 108(11): 599-623. doi: 10.1139/F54-039
[7] QUINN Ⅱ T J, DERISO R B. Quantitiative fish dynamics[M]. New York: Oxford University Press, 1999. doi: 10.1093/oso/9780195076318.001.0001
[8] ZHAO X, HAMRE J, LI F, et al. Recruitment, sustainable yield and possible ecological consquences of the sharp decline of the anchovy (Engraulis japonicus) stock in the Yellow Sea in the 1990s[J]. Fish Oceanogr, 2003, 12(4): 495-501. doi: 10.1046/j.1365-2419.2003.00262.x
[9] WANG Yanjun, LIU Qun, YE Zhenjiang. A bayesian analysis on the anchovy stock (Engraulis japonicus) in the Yellow Sea[J]. Fish Res, 2006, 82(1/3): 87-94. doi: 10.1016/j.fishres.2006.08.007
[10] 詹秉义. 渔业资源评估[M]. 北京: 中国农业出版社, 1995: 208-215. https://book.douban.com/subject/2048040/ [11] 邓景耀, 叶昌臣. 渔业资源学[M]. 重庆: 重庆出版社, 2000: 124-131. https://www.dushu.com/book/10041543/
计量
- 文章访问数: 5385
- HTML全文浏览量: 157
- PDF下载量: 3466
 粤公网安备 44010502001741号
