
Progress in study and application of fish bioenergetics models
-
摘要:
鱼类生物能量学在渔业资源管理和可持续利用方面至关重要。文章综述了近年来该领域的研究进展,重点关注生物能量学模型的发展,探讨了水温和水流等环境因子对鱼类能量收支的影响。在生产实践中,鱼类生物能量学模型可用于预测自然鱼类资源的动态变化以及养殖鱼类污染物的排放等,为渔业管理提供科学依据,但在应对复杂的环境变化时,模型的适应性和精确性仍有待提升。此外,现有模型常忽视了影响因子之间的交互作用。未来的研究应专注于多学科数据融合、先进技术的应用以及个体化模型的创新,从而促进鱼类生物能量学模型的不断完善,朝着精确化、实用化和可持续管理的方向发展。
Abstract:Fish bioenergetics plays an important role in the management and sustainable utilization of fisheries resources. This paper provides an overview of recent advance in this field, focusing on the development of bioenergetics models. It also delves into the intricate interplay of environmental factors such as water temperature and flow on fish energy budgets. In practical scenarios, fish bioenergetics models are used to predict the dynamics of natural fish resources and the emission of pollutants from aquaculture, providing scientific support for fisheries management. However, the adaptability and accuracy of these models in dealing with complex environmental changes still need to be improved. Additionally, existed models often overlook the complexity of interactions among influencing factors. Future research should focus on multidisciplinary data fusion, application of advanced technologies, and innovation of individualised models, so as to facilitate the continuous improvement of fish bioenergetics models and promote their development towards precision, practicality and sustainable management.
-
Keywords:
- Fish bioenergetics /
- Bioenergetics modeling /
- Energy balance /
- Key factors
-
近海海域在中国经济发展中具有重要的服务功能和战略地位。随着对近海海域的开发和利用,其环境逐渐面临诸多污染问题,其中石油类污染是主要污染问题之一。据国际油轮船东防污染联合会 (International Tanker Owners Pollution Federation, ITOPF) 的数据显示,2023年约有2 000 吨石油意外泄漏到环境中。国际海事组织 (International Maritime Organization, IMO) 和国际能源署 (International energy agency, IEA) 的报告显示,全球海上运输的油品中,原油和柴油的运输占比较高[1],因此原油和柴油污染对海洋生物的影响值得关注。此外,原油和柴油可以引起鱼类代谢紊乱、心脏速率减缓,甚至幼鱼发育畸形等问题[2];也会对多毛类[3]、虾类[4]、海洋藻类[5]、贝类[6]等生物的生长发育造成影响。因此,研究溢油污染对海洋生物生长发育的毒性效应,对保护海洋生态环境和渔业经济具有重要意义。
生物标志物是指环境因子对生物体产生的影响所导致的可测定变化,具有高敏感性的特点[7]。抗氧化酶系统和基因表达水平常用作生物标志物,指示污染及评估其生物毒性效应。蒋凤华等[8]使用超氧化物歧化酶 (SOD) 和过氧化氢酶 (CAT) 2种抗氧化酶生物标志物评估了不同浓度原油水溶性组分 (Water soluble fraction of crude oil, WSF) 对栉孔扇贝 (Chlamys farreri) 鳃和消化腺的毒性效应,结果显示SOD和CAT的活性随WSF暴露时间的增加呈降低-升高-降低的趋势;Xia等[9]通过测定菲律宾蛤仔 (Ruditapes philippinarum) 的抗氧化酶活性,发现石油类污染与该生物标志物之间存在剂量-效应和时间-效应关系。
综合生物标志物响应 (Integrated biological response, IBR) 指数通过将多个生物标志物与图形结合,从而更全面地判断生物的毒性响应,评估生态系统的健康状态[10]。Wang等[11]通过IBR指数评价重金属汞对鲢 (Hypophthalmichthys molitrix) 幼体的慢性毒性效应,发现汞会降低其抗氧化能力,导致机体功能受损;Jiang等[12]使用IBR指数评估缢蛏 (Sinonovacula constricta) 4种抗氧化酶对柴油和原油含水馏分 (Water accommodated fraction, WAF) 的氧化应激反应,结果显示不同浓度的石油污染物对4种抗氧化酶的诱导程度不同,且柴油的毒性大于原油。
凡纳滨对虾 (Litopenaeus vannamei) 又名南美白对虾,其生长快、抗逆性强、出肉率高且经济价值高,是全球养殖产量最高的经济虾类,2023年中国的养殖产量达220万吨[13]。凡纳滨对虾作为具有开放式血淋巴管系统的变温动物,其生理状态更易受到水体环境变化的影响[14]。本研究探讨了LH原油和0# 柴油对凡纳滨对虾肝胰腺抗氧化酶活性及相关功能基因表达的影响,以期为评估石油类污染对海洋生物的毒性效应提供基础数据支持。
1. 材料与方法
1.1 实验生物
凡纳滨对虾来自中国水产科学研究院南海水产研究所深圳试验基地,平均体质量为(6.50±0.21) g。正式实验前,将对虾置于室内300 L养殖桶中暂养7 d,养殖期间保持水温 (29.2±0.5) ℃、盐度30‰、pH 7.8~8.0,24 h连续充气,每天早晚各投喂1次,每日对虾配合饲料投喂量为虾体质量的5%,对虾日死亡率低于1‰ 时开始正式实验。
1.2 实验试剂及母液制备
1.2.1 试剂
南海LH原油来源于中国南海流花油田;0# 柴油采购自广州市加油站;富肯-3号溢油分散剂由广州富肯环保科技有限公司提供;正己烷、乙醇、乙醚等试剂购自国药控股广州有限公司,均为分析纯。
1.2.2 南海LH原油和0# 柴油母液及工作液制备
南海LH原油和0# 柴油乳化母液的配制方法参考文献 [15]:将分散剂分别按体积比1∶1与南海LH原油、0# 柴油混合后,置于超声波洗涤器中超声处理5 min,然后将混合液按体积比1∶10与过滤海水混合,连续超声处理3 h,再置于分液漏斗中静置3 h,取其下层水相液置于棕色瓶中,即为LH原油和0# 柴油母液。制备后的LH原油和0# 柴油母液参照GB 17378.4—2007《海洋监测规范 第4部分:海水分析》,采用紫外分光光度计法测定石油烃含量。在每次配制工作液前,先测定1次母液的石油烃浓度,随后使用分散剂梯度稀释母液用于制备实验用工作液,以保证每组工作液中分散剂浓度一致。工作液均为现用现配。
1.3 胁迫实验及样品采集
根据前期本实验室开展的急性毒性实验结果[15],LH原油和0# 柴油均设置3个实验浓度组,分别为低浓度组 (A组,25 μg·L−1)、中浓度组 (B组,50 μg·L−1) 和高浓度组 (C组,250 μg·L−1),和1个分散剂对照组 (D组,0 μg·L−1)。将240尾对虾分为4组,每组3个平行,每个平行20尾。连续胁迫15 d,每8 h换水1次,换水后使用工作液调节石油烃浓度至所设置浓度,分别于胁迫第1、第7和第15天在投喂及换水前取样,每组6尾,取肝胰腺迅速在液氮中冷冻,并储存于 −80 ℃冰箱。
1.4 样品处理及生理指标测定
将对虾肝胰腺取出,液氮研磨后分为2份,分别用于生理指标测定和基因表达分析。按照试剂盒说明书 (南京建成生物工程研究所) 测定SOD、CAT、过氧化物酶 (POD)、谷胱甘肽S转移酶 (GST)、谷胱甘肽过氧化物酶 (GPx) 的活性及还原型谷胱甘肽 (GSH) 的含量。
1.5 基因表达分析
根据已发表的文献,以凡纳滨对虾Lvactin为内参基因,选择细胞凋亡因子caspase2—caspase5、延伸因子 (EF)、SOD、CAT、GPx、过氧化物还原酶 (Prx)、酚氧化酶原 (proPO) 和溶菌酶 (LZM) 基因进行表达量的测定。引物序列见表1。
表 1 荧光定量PCR引物Table 1. Primers for fluorescent quantitative PCR引物名称
Primer引物序列 (5'—3')
Primer sequence (5'−3')退火温度
Annealing temperature/
℃参考文献
Reference引物名称
Primer引物序列 (5'—3')
Primer sequence (5'−3')退火温度
Annealing temperature/
℃参考文献
ReferenceLvcasp2-F ATGGCTCGTGGTTCATTCAG 57.8 [16] LvCAT-F ATCCATTCGACCTTACCA 52.7 [17] Lvcasp2-R CATCAGGGTTGAGACAATACAGG 60.2 [16] LvGPx-F GGCACCAGGAGAACACTAC 59.7 [17] Lvcasp3-F AGTTAGTACAAACAGATTGGAGCG 58.6 [16] LvCAT-R ACGCAATCTGCTCCACCT 57.3 [17] Lvcasp3-R TTGTGGACAGACAGTATGAGGC 60.1 [16] LvGPx-R CGACTTTGCCGAACATAAC 55.4 [17] Lvcasp4-F CATGCTTGACATACCCGATG 57.8 [16] LvPrx-F AGGAAGGTGGTCTTGGTACA 57.8 [17] Lvcasp4-R TGTCCGGCATTGTTGAGTAG 60.2 [16] LvPrx-R GCAGATCATTGATTGTTACCT 54.1 [17] Lvcasp5-F GAAGGAGTGAAGCTAAACGAGAC 60.3 [16] LvPro-F CGGTGACAAAGTTCCTCTTC 57.8 [18] Lvcasp5-R CAGTAGACCAGCAGATAAGGAAGT 61.9 [16] LvPro-R GCAGGTCGCCGTAGTAAG 59.6 [18] LvEF-1α-F GAAGTAGCCGCCCTGGTTG 61.9 [16] LvLZM-F GGACTACGGCATCTTCCAGA 59.8 [18] LvEF-1α-R CGGTTAGCCTTGGGGTTGAG 61.9 [16] LvLZM-R ATCGGACATCAGATCGGAAC 57.8 [18] LvSOD-F GAATTGGGTGAGGAACGA 55.0 [17] Lvactin-F CAAGATGTGTGACGACGAAG 57.8 [17] LvSOD-R ATGTAGCCCTGGTGATGC 57.3 [17] Lvactin-R AGCTCGTGGTGCATCGTC 59.6 [17] 1.6 荧光定量PCR
采用TaKaRa SYBR® Green I荧光定量试剂盒在罗氏LC480荧光定量PCR仪上进行荧光定量PCR分析,体系配制及PCR反应条件参照试剂盒说明书。
1.7 数据分析
荧光定量结果分析使用2−ΔΔCt法计算基因的相对表达量[19];IBR指数采用第二代综合生物标志物响应法 (Integrated biological response version 2, IBRv2),计算方法参照文献 [20-21];实验数据用Excel 2019软件进行统计整理,以“平均值±标准差 ($\overline { x}\pm s $)”表示;利用IBM SPSS 19.0软件进行单因素方差分析 (One-way ANOVA),差异显著性通过Tukey's HSD法检验,显著性水平α为 0.05;采用GraphPad Prism 9.0和Origin 2021软件制图。
2. 结果
2.1 生理指标分析
随LH原油胁迫时间的延长,中、高浓度组SOD、CAT、POD、GST和GPx活性总体呈升高趋势,并显著高于对照组 (p<0.05),表现出一定的时间-效应和剂量-效应 (图1)。低浓度组SOD、CAT、GST和GPx活性在第1和第7天均与对照组无显著性差异 (p>0.05)。GSH含量总体呈先上升后下降的趋势,各浓度组均在第7天达到最大值,在第15天时各浓度组GSH含量均显著低于对照组 (p<0.05)。
![]() 图 1 不同浓度LH原油乳化液对凡纳滨对虾肝胰腺抗氧化酶的影响注:* 表示组间存在显著性差异 (p<0.05);** 表示组间存在非常显著性差异 (p<0.01);*** 表示组间存在极显著性差异 (p<0.001)。Figure 1. Effects of LH crude oil emulsion on hepatopancreatic antioxidant enzyme activities of L. vannameiNote: * represents significant differences among the groups (p<0.05); ** represents very significant differences among the groups (p<0.01); *** represents extremely significant differences among the groups (p<0.001).
图 1 不同浓度LH原油乳化液对凡纳滨对虾肝胰腺抗氧化酶的影响注:* 表示组间存在显著性差异 (p<0.05);** 表示组间存在非常显著性差异 (p<0.01);*** 表示组间存在极显著性差异 (p<0.001)。Figure 1. Effects of LH crude oil emulsion on hepatopancreatic antioxidant enzyme activities of L. vannameiNote: * represents significant differences among the groups (p<0.05); ** represents very significant differences among the groups (p<0.01); *** represents extremely significant differences among the groups (p<0.001).随0# 柴油胁迫时间的延长,SOD、CAT、GST活性和GSH含量均显著低于对照组 (p<0.05),表现出一定的时间-效应关系 (图2)。中、高浓度组POD活性总体呈先升高后降低的趋势,至胁迫后期 (第15天) 各浓度组均显著低于对照组 (p<0.05)。GPx活性总体呈上升趋势,各浓度组均在第15天达最大值 (p<0.05)。
![]() 图 2 不同浓度0# 柴油乳化液对凡纳滨对虾肝胰腺抗氧化酶的影响注:* 表示组间存在显著性差异 (p<0.05);** 表示组间存在非常显著性差异 (p<0.01);*** 表示组间存在极显著性差异 (p<0.001)。Figure 2. Effects of No.0 diesel oil emulsion on hepatopancreatic antioxidant enzyme activities of L. vannameiNote: * represents significant differences among the groups (p<0.05); ** represents very significant differences among the groups (p<0.01); *** represents extremely significant differences among the groups (p<0.001).
图 2 不同浓度0# 柴油乳化液对凡纳滨对虾肝胰腺抗氧化酶的影响注:* 表示组间存在显著性差异 (p<0.05);** 表示组间存在非常显著性差异 (p<0.01);*** 表示组间存在极显著性差异 (p<0.001)。Figure 2. Effects of No.0 diesel oil emulsion on hepatopancreatic antioxidant enzyme activities of L. vannameiNote: * represents significant differences among the groups (p<0.05); ** represents very significant differences among the groups (p<0.01); *** represents extremely significant differences among the groups (p<0.001).2.2 相关功能基因表达分析
随LH原油胁迫时间的延长,中、高浓度组SOD、CAT和GPx基因表达量逐渐上升并显著高于对照组 (p<0.05);中、高浓度组LZM、EF、proPO表达量呈先上升后下降的趋势;各浓度组caspase2、Prx表达量均显著低于对照组 (p<0.05,图3)。
![]() 图 3 不同浓度LH原油乳化液对凡纳滨对虾肝胰腺功能基因表达的影响注:* 表示组间存在显著性差异 (p<0.05);** 表示组间存在非常显著性差异 (p<0.01);*** 表示组间存在极显著性差异 (p<0.001)。Figure 3. Effects of LH crude oil emulsion on hepatopancreatic relative gene expression of L. vannameiNote: * represents significant differences among the groups (p<0.05); ** represents very significant difference among the groups (p<0.01); *** represents extremely significant differences among the groups (p<0.001).
图 3 不同浓度LH原油乳化液对凡纳滨对虾肝胰腺功能基因表达的影响注:* 表示组间存在显著性差异 (p<0.05);** 表示组间存在非常显著性差异 (p<0.01);*** 表示组间存在极显著性差异 (p<0.001)。Figure 3. Effects of LH crude oil emulsion on hepatopancreatic relative gene expression of L. vannameiNote: * represents significant differences among the groups (p<0.05); ** represents very significant difference among the groups (p<0.01); *** represents extremely significant differences among the groups (p<0.001).随0# 柴油胁迫时间的延长,各浓度组SOD表达量呈先升高后下降的变化趋势;高浓度组CAT、LZM、caspase2、EF表达量呈下降趋势;低、高浓度组Prx和各浓度组proPO表达量呈先下降后升高的趋势;至胁迫第15天,SOD、CAT、LZM、caspase2表达量被显著抑制 (p<0.05),而GPx、Prx、proPO和低、中浓度组EF表达量均显著高于对照组 (p<0.05,图4)。
![]() 图 4 不同浓度0# 柴油乳化液对凡纳滨对虾肝胰腺功能基因表达的影响注:* 表示组间存在显著性差异 (p<0.05);** 表示组间存在非常显著性差异 (p<0.01);*** 表示组间存在极显著性差异 (p<0.001)。Figure 4. Effects of NO.0 diesel oil emulsion on hepatopancreatic relative gene expression of L. vannameiNote: * represents significant differences among the groups (p<0.05); ** represents very significant differences among the groups (p<0.01); *** represents extremely significant differences among the groups (p<0.001).
图 4 不同浓度0# 柴油乳化液对凡纳滨对虾肝胰腺功能基因表达的影响注:* 表示组间存在显著性差异 (p<0.05);** 表示组间存在非常显著性差异 (p<0.01);*** 表示组间存在极显著性差异 (p<0.001)。Figure 4. Effects of NO.0 diesel oil emulsion on hepatopancreatic relative gene expression of L. vannameiNote: * represents significant differences among the groups (p<0.05); ** represents very significant differences among the groups (p<0.01); *** represents extremely significant differences among the groups (p<0.001).2.3 综合生物标志物响应 (IBR) 变化
不同浓度LH原油和0# 柴油胁迫下,凡纳滨对虾肝胰腺生物标志物IBRv2结果如图5所示。胁迫第1天时,高浓度组均具有最大覆盖面积;胁迫第7天时,中浓度组均具有最大覆盖面积;胁迫第15天时,原油中浓度组覆盖面积最大,柴油低浓度组覆盖面积最大。
![]() 图 5 LH原油和0# 柴油乳化液胁迫下凡纳滨对虾生物标志物IBRv2分析注:抗氧化酶指标包括SOD、CAT、POD、GST、GPx及GSH;基因表达指标包括SOD、CAT、GPx、LZM、caspase2、Prx、EF及proPO;a—c分别代表LH原油胁迫组第1、第7和第15天各生物标志物的IBRv2分析;d—f分别代表0# 柴油胁迫组第1、第7和第15天各生物标志物的IBRv2分析。Figure 5. IBRv2 analysis of biomarkers in L. vannamei after exposure to emulsion of LH crude oil and No.0 diesel oilNote: The antioxidant enzyme indicators include SOD, CAT, POD, GST, GPx and GSH, and the gene expression indicators include SOD, CAT, GPx, LZM, caspase2, Prx, EF and proPO. a−c and d−f represent the IBRv2 analysis of the biomarkers in the LH crude oil and NO.0 diesel oil exposure groups on 1st, 7th and 15th day, respectively.
图 5 LH原油和0# 柴油乳化液胁迫下凡纳滨对虾生物标志物IBRv2分析注:抗氧化酶指标包括SOD、CAT、POD、GST、GPx及GSH;基因表达指标包括SOD、CAT、GPx、LZM、caspase2、Prx、EF及proPO;a—c分别代表LH原油胁迫组第1、第7和第15天各生物标志物的IBRv2分析;d—f分别代表0# 柴油胁迫组第1、第7和第15天各生物标志物的IBRv2分析。Figure 5. IBRv2 analysis of biomarkers in L. vannamei after exposure to emulsion of LH crude oil and No.0 diesel oilNote: The antioxidant enzyme indicators include SOD, CAT, POD, GST, GPx and GSH, and the gene expression indicators include SOD, CAT, GPx, LZM, caspase2, Prx, EF and proPO. a−c and d−f represent the IBRv2 analysis of the biomarkers in the LH crude oil and NO.0 diesel oil exposure groups on 1st, 7th and 15th day, respectively.LH原油胁迫第1天时,低浓度组对Prx表达量有较大影响,中、高浓度组对EF、CAT表达量影响较大;第7天时,EF表达量在低浓度组中的响应水平较高,POD活性在中浓度组中的响应水平较高,CAT活性及其基因表达量在高浓度组中的响应水平较高;第15天时,GPx活性及其基因表达量在各浓度组中均有较高的响应水平。在0# 柴油胁迫的3个时间节点中,各浓度组GPx活性及其基因表达量均有较高的响应水平;胁迫第1天时,CAT表达量在低浓度组中的响应水平较高;第15天时,高浓度组caspase2基因表达量和CAT活性均有较高的响应水平。
对14种生物标志物的偏差系数绝对值进行求和,得到IBRv2值 (图6)。随LH原油和0# 柴油胁迫浓度的增加和时间的延长,IBRv2值呈剂量-效应和时间-效应关系。在胁迫的3个时间点中,其IBRv2值大小均为低浓度组<中浓度组<高浓度组;在相同浓度的LH原油和0# 柴油胁迫下,其IBRv2值随胁迫时间的延长呈升高趋势,均表现为第1天<第7天<第15天,且柴油组生物标志物基因表达量的IBRv2值变化范围均大于原油组。
![]() 图 6 LH原油 (a) 和0# 柴油 (b) 胁迫下凡纳滨对虾肝胰腺生物标志物IBRv2值的时间变化 (n=6)Figure 6. Variation of IBRv2 along with exposure time in hepatopancreatic biomarkers of L. vannamei underLH crude oil (a) and No.0 diesel oil (b) stress (n=6)
图 6 LH原油 (a) 和0# 柴油 (b) 胁迫下凡纳滨对虾肝胰腺生物标志物IBRv2值的时间变化 (n=6)Figure 6. Variation of IBRv2 along with exposure time in hepatopancreatic biomarkers of L. vannamei underLH crude oil (a) and No.0 diesel oil (b) stress (n=6)2.4 生物标志物PCA分析
对LH原油胁迫下的14个生物标志物进行PCA分析 (图7-a),主成分1 (PC1) 和主成分2 (PC2) 分别解释了总变异的46.81%和15.32%。其中,PC1与SOD、CAT、GPx的活性和表达量具有较强的相关性,上述抗氧化酶活性及其基因表达量与中、高浓度组LH原油的长期胁迫 (15 d) 具有较强的相关性;PC2与EF、caspase2基因表达有关,说明低浓度组长期胁迫及高浓度组短期胁迫 (1 d) 与延伸因子、细胞凋亡因子有较强的相关性。
![]() 图 7 LH原油 (a) 和0# 柴油 (b) 乳化液胁迫下凡纳滨对虾肝胰腺中生物标志物的PCA分析注:抗氧化酶指标包括SOD、CAT、POD、GST、GPx和GSH;基因表达指标包括SOD、CAT、GPx、LZM、caspase2、Prx、EF及proPO。图中不同颜色的点分别代表各胁迫组,例如7-a中的红点“A15d”代表低浓度组 (A组,25 μg·L−1) 原油胁迫凡纳滨对虾15 d,其他颜色的点以此类推。Figure 7. Results of PCA analysis of biomarkers in hepatopancreas of L. vannamei exposed to emulsion of LH crude oil (a) and No.0 diesel oil (b)Note: The antioxidant enzyme indicators include SOD, CAT, POD, GST, GPx and GSH, the gene expression indicators included SOD, CAT, GPx, LZM, caspase2, Prx, EF and proPO. The different colored dots represent the stress groups. For example, the red dot "A15d" in Fig. 7-a means that the low concentration group (group A, 25 μg·L−1) of crude oil was stressed for 15 d, and the other colored dots are similar.
图 7 LH原油 (a) 和0# 柴油 (b) 乳化液胁迫下凡纳滨对虾肝胰腺中生物标志物的PCA分析注:抗氧化酶指标包括SOD、CAT、POD、GST、GPx和GSH;基因表达指标包括SOD、CAT、GPx、LZM、caspase2、Prx、EF及proPO。图中不同颜色的点分别代表各胁迫组,例如7-a中的红点“A15d”代表低浓度组 (A组,25 μg·L−1) 原油胁迫凡纳滨对虾15 d,其他颜色的点以此类推。Figure 7. Results of PCA analysis of biomarkers in hepatopancreas of L. vannamei exposed to emulsion of LH crude oil (a) and No.0 diesel oil (b)Note: The antioxidant enzyme indicators include SOD, CAT, POD, GST, GPx and GSH, the gene expression indicators included SOD, CAT, GPx, LZM, caspase2, Prx, EF and proPO. The different colored dots represent the stress groups. For example, the red dot "A15d" in Fig. 7-a means that the low concentration group (group A, 25 μg·L−1) of crude oil was stressed for 15 d, and the other colored dots are similar.对0# 柴油胁迫下的14个生物标志物进行PCA分析 (图7-b),PC1解释了40.56%,与SOD、CAT、GSH活性和caspase2、proPO表达量的相关性较强,表明低、中浓度组短期胁迫和高浓度组长期胁迫对抗氧化酶活性、酚氧化酶原系统和细胞凋亡基因的影响较大;PC2解释了19.02%,与POD活性和GPx、SOD表达量相关性较强,表明中浓度组长期胁迫 (7 d) 和高浓度组短期胁迫对抗氧化酶的影响较大。
3. 讨论
3.1 LH原油和0# 柴油对凡纳滨对虾肝胰腺抗氧化酶活性的影响
在环境胁迫下,生物机体会通过氧化代谢产生过量的活性氧自由基 (Reactive oxygen species, ROS),当ROS含量超过机体的清除能力将引发氧化应激反应,从而损伤细胞膜、使酶失活,并造成遗传物质等重要细胞成分氧化损伤,进一步诱导细胞凋亡[22]。研究表明,肝胰腺由于在消化、物质储备、脂质代谢、解毒等方面具有较高的代谢率,因此在环境胁迫中更容易受到氧化应激的影响[23]。
本研究中,SOD、CAT活性随着LH原油浓度的增加和胁迫时间的延长而逐渐上升,可能是由于机体在LH原油长期胁迫下,应激生成大量SOD、CAT用于清除过量的ROS,以减轻污染物胁迫所带来的伤害。相似的结果在李磊等[24]的研究中也有体现,在0.45和0.05 μg·L−1苯并[a]芘 (BaP) 胁迫下,脊尾白虾 (Exopalaemon carinicauda) 的SOD活性均逐渐上升,在第15天时2个实验组的SOD活性分别为第0天的3.04和2.38倍;王琪等[25]的研究也发现,随着菲胁迫浓度的增加,各浓度组泥鳅 (Misgurnus anguillicaudatus) 肝脏中的CAT活性显著上升。暴露于0# 柴油乳化液中第1天时,SOD、CAT活性与对照组无显著性差异,但随着胁迫时间延长和浓度增加,SOD、CAT活性逐渐降低,可能是因为在柴油胁迫初期,ROS积累远高于抗氧化酶的清除效率,造成机体损伤[26]。相似的结果也见于黑鲷 (Sparus macrocephalus) 肝脏[27],SOD和CAT活性随0# 柴油浓度的增加和胁迫时间的延长呈下降趋势,可能是由于ROS积累使SOD和CAT的酶蛋白结构、底物亲和力等受到损伤[28]。
研究表明,生物体在轻度胁迫时POD活性通常会升高,但长期胁迫会导致氧化损伤并引发细胞病变[29]。本研究中,随着LH原油胁迫时间的延长,各浓度组POD活性呈先升后降的变化趋势,说明原油短期胁迫可激活凡纳滨对虾的抗氧化防御系统,POD活性增强以减少ROS对机体的损伤,这与李传慧[30]的研究结果一致;但高浓度组的活性比中浓度组要低,可能是因为高浓度组胁迫超出了机体的生理调节范围,对机体的刺激作用增强[31]。与原油不同,0# 柴油长期胁迫时,各浓度组POD活性均被显著抑制,说明0# 柴油长期胁迫使凡纳滨对虾肝胰腺细胞严重损伤,导致其氧化应激能力下降。
从剂量-效应和时间-效应关系分析,LH原油胁迫使GST活性逐渐上升,以减少ROS的伤害,表明机体对胁迫产生了适应性反应。而高浓度组柴油的GST活性先升后降,可能是因为在相II反应酶系中,GST与各种亲电性化合物或某些相I代谢产物结合,并催化GSH反应生成水溶性的GSH硫结合物,起到脱毒作用。但高浓度组长期胁迫削弱了结合能力,破坏氧化还原平衡而抑制了GST活性。相似的结果在张先勇等[32]和任加云等[33]的研究中也有体现,BaP长期胁迫马氏珠母贝 (Pinctada martensii) 导致GST活性降低,多环芳烃 (PAHs) 长时间胁迫栉孔扇贝也会抑制其GST活性。
在本研究中,GPx活性与2种石油污染物之间呈显著的时间-效应和剂量-效应正相关关系。GSH含量在石油类短期胁迫中显著上升,可能是因为GPx催化GSH将过氧化氢 (H2O2) 分解为水,使得GPx活性增加,从而加速GSH对H2O2 的分解以清除过量的ROS[34]。随着柴油胁迫时间的延长,GSH含量显著下降,可能是由于GSH与石油烃中的有毒物质结合解毒,或是GSH在清除ROS时被GPx催化为了二硫化谷胱甘肽 (Glutathione disculfide, GSSG)[35-36]。
从2种石油对SOD、CAT、POD活性的时间影响来看,柴油各浓度组的最大诱导出现的时间 (第1天) 要早于原油 (第7和第15天),且在胁迫15 d后,柴油组抗氧化酶 (除GPx外) 的活性基本低于对照组,0# 柴油对酶活性的影响更显著,这与黄南建等[15]的研究结果一致。2种石油的毒性差异可能是由于其所含组分不同;通常,柴油中的饱和烷烃和芳香烃占比均高于原油[37],因此0# 柴油对凡纳滨对虾肝胰腺抗氧化酶活性的影响大于LH原油。
3.2 LH原油和0# 柴油对凡纳滨对虾肝胰腺功能基因表达的影响
本研究中,凡纳滨对虾在低浓度组石油污染物胁迫下,SOD和CAT基因表达的显著诱导时间 (1 d) 早于其酶活性,且在高浓度组LH原油胁迫下,抗氧化酶的基因表达量诱导倍数也大于酶活性的诱导倍数,说明相关功能基因表达量作为生物标志物可能具有更高的敏感性。在镉 (Cd)胁迫暗纹东方鲀 (Takifugu obscurus)[38]和锌离子 (Zn2+) 胁迫花斑裸鲤 (Gymnocypris eckloni)[39]的研究中也有体现,SOD、CAT、GPx表达量在肝脏中显著升高,表明相关功能基因表达量可能是氧化应激反应的重要生物标志物。
氧化应激会改变caspase家族等凋亡相关基因的表达,从而诱导细胞凋亡[40],其中的caspase2是关键基因。在本研究中,caspase2表达量在2种石油污染物胁迫下均呈现先升高后下降的趋势,高浓度组显著低于对照组,可能是胁迫初期机体上调基因表达应对初步损伤并诱发细胞凋亡[41-42],随着胁迫时间延长和毒素浓度增加,细胞的应激响应被抑制,caspase2表达量下降可能意味着细胞凋亡的终止或损伤修复机制的激活。本研究中,EF表达量在LH原油胁迫下先升高后下降,可能是胁迫初期机体诱导EF表达以提高蛋白质的合成速率,修复氧化损伤,但因长期胁迫无法维持正常代谢和生理状态,导致EF表达量下降。在0# 柴油胁迫下,低、中浓度组EF表达量均显著升高,说明EF可能参与了响应氧化应激的凋亡程序,通过肌动蛋白束缚等方式保护细胞免受caspase家族介导的细胞凋亡[43]。因此,推测caspase2表达量的下降是由于EF的抑制作用;高浓度组可能导致过量的细胞毒性,损伤细胞的代谢和蛋白合成路径。
在原油和柴油的胁迫下,各浓度组LZM表达量呈先升高后下降的趋势,这与柴油胁迫虹鳟 (Oncorhynchus mykiss)[44]的研究结果一致,可能是胁迫初期凡纳滨对虾增加LZM表达量以应答环境胁迫;随胁迫时间的延长,机体生理功能紊乱,免疫能力降低,LZM表达量下降。在原油胁迫下,各浓度组proPO表达量呈先升高后下降的趋势,低浓度组表达量在暴露第7天时达到峰值,高浓度组的表达量显著低于对照组。表明凡纳滨对虾在受原油胁迫时可以激活proPO系统,产生大量的酚氧化酶 (Phenoloxidase, PO) 应对环境变化,但随胁迫时间的延长,过量ROS积累导致细胞组织受损,proPO表达量下降。这与盐碱胁迫中华绒螯蟹 (Eriocheir sinensis) 的变化趋势相似[45]。而在柴油胁迫下,proPO表达量先降再升,可能是因为柴油直接抑制了proPO,导致细胞应激反应机制暂时失调,持续胁迫后机体产生了适应并激活了免疫系统。
本研究中,原油胁迫下的Prx表达量显著低于对照组,可能是因为原油中的PAHs损伤了相关的信号传递路径,破坏了细胞的抗氧化防御系统。而柴油胁迫下的Prx表达量呈上升趋势,可能是细胞通过增加Prx表达量应对氧化应激,保护自身免受损伤。相似的结果在Zhuang等[46]的研究中也有体现,将桡足类分别暴露在2种PAHs中,1, 2-NAPH胁迫下Prx表达量显著上调,芘胁迫下则显著下调,说明生物对不同的PAHs胁迫表现出敏感性差异,会导致不同的基因表达模式。
3.3 LH原油和0# 柴油暴露对凡纳滨对虾毒性效应的IBR及PCA分析
有研究表明,一般情况下,基因表达通常在氧化应激早期迅速变化,酶活反应则较为缓慢[47]。本研究中,SOD表达量在低浓度LH原油胁迫初期已显著上升,而SOD活性在高浓度胁迫下才显著上升。在低氧胁迫鲢的研究中也有相似的结果[48],SOD表达量在浮头组已显著上升,而SOD活性在窒息组才显著下降。说明基因表达变化可能比酶活性变化更早发生,而酶活性显著变化可能在较高浓度或长时间胁迫后才出现。
本研究的IBRv2分析结果显示,石油污染物短期胁迫凡纳滨对虾时,高浓度组对生物标志物的影响最大;随胁迫时间的延长,低、中浓度组柴油对凡纳滨对虾的影响更大,原油组则是中浓度组影响最大,高浓度组次之。在0硫柴油和平湖原油WAF分别胁迫缢蛏的研究中发现,2种油品的毒性差异源于组分不同,且柴油毒性大于原油[12]。因此,本研究中高浓度组柴油短期胁迫可能已对对虾造成了不可逆转的氧化损伤,而低、中浓度组长时间胁迫可能损伤细胞结构和功能。随2种油品胁迫浓度的增加和时间的延长,IBRv2值呈剂量-效应和时间-效应关系,类似结果在菲胁迫泥鳅的研究中也有体现[25],其综合毒性应激水平随着菲的暴露水平和时间的增加而上升。柴油组生物标志物基因表达量的IBRv2值变化范围均大于原油组,说明其表现出了更高的响应水平。Xu等[49]和Lu等[50]的研究也表明,生物标志物基因表达量在胁迫初期就显著变化,早于酶活性。
PCA分析结果显示,LH原油和0# 柴油的长期和短期胁迫均显著影响抗氧化酶活性及其基因表达,同时也影响细胞凋亡相关基因的表达。但2种油品所影响的生物标志物存在差异:低浓度组LH原油长期胁迫和高浓度组短期胁迫显著影响EF,而低、中浓度组0# 柴油短期胁迫和高浓度组长期胁迫显著影响proPO系统。可能是由于0# 柴油含有更多低分子量的化合物和芳香烃,毒性大于LH原油[15];EF通常与维持细胞蛋白质稳定性相关,其表达量增加是促氧化剂诱导细胞凋亡的早期事件[43],LH原油中的芳香烃等应激因素可能会引起蛋白质氧化等细胞损伤,导致EF表达量变化[51];而在PAHs类污染物屈 (Chrysene) 胁迫斑节对虾 (Penaeus monodon) 实验[52]中,proPO表达量显著下调,表明PAHs影响生物的生长和免疫系统。
研究表明,测定生物标志物CAT和GPx等的酶活性,可以显著区分不同养殖模式污染下的虾类[53]。在本研究中,PCA与IBRv2的分析结果相似,CAT和GPx的活性及表达量在2种油品胁迫下均受到显著影响,因此推测CAT和GPx的活性及表达量可以作为预测LH原油和0# 柴油污染暴露的早期预警生物标志物。
4. 结论
在LH原油和0# 柴油胁迫下,凡纳滨对虾肝胰腺抗氧化酶活性和抗氧化防御、细胞凋亡及免疫相关基因的表达均随油品浓度增加和胁迫时间延长而显著变化,其中0# 柴油的影响更为显著,表明凡纳滨对虾对0# 柴油的敏感性高于LH原油。IBRv2值的变化也显示出不同浓度和时间下的生物毒性差异,说明该指数可作为评估不同油品污染对凡纳滨对虾综合毒性效应的有效工具。此外,CAT和GPx的活性及表达量与油品暴露有较强的相关性,推测其可作为预测石油污染暴露的早期预警指标。
-
![]()
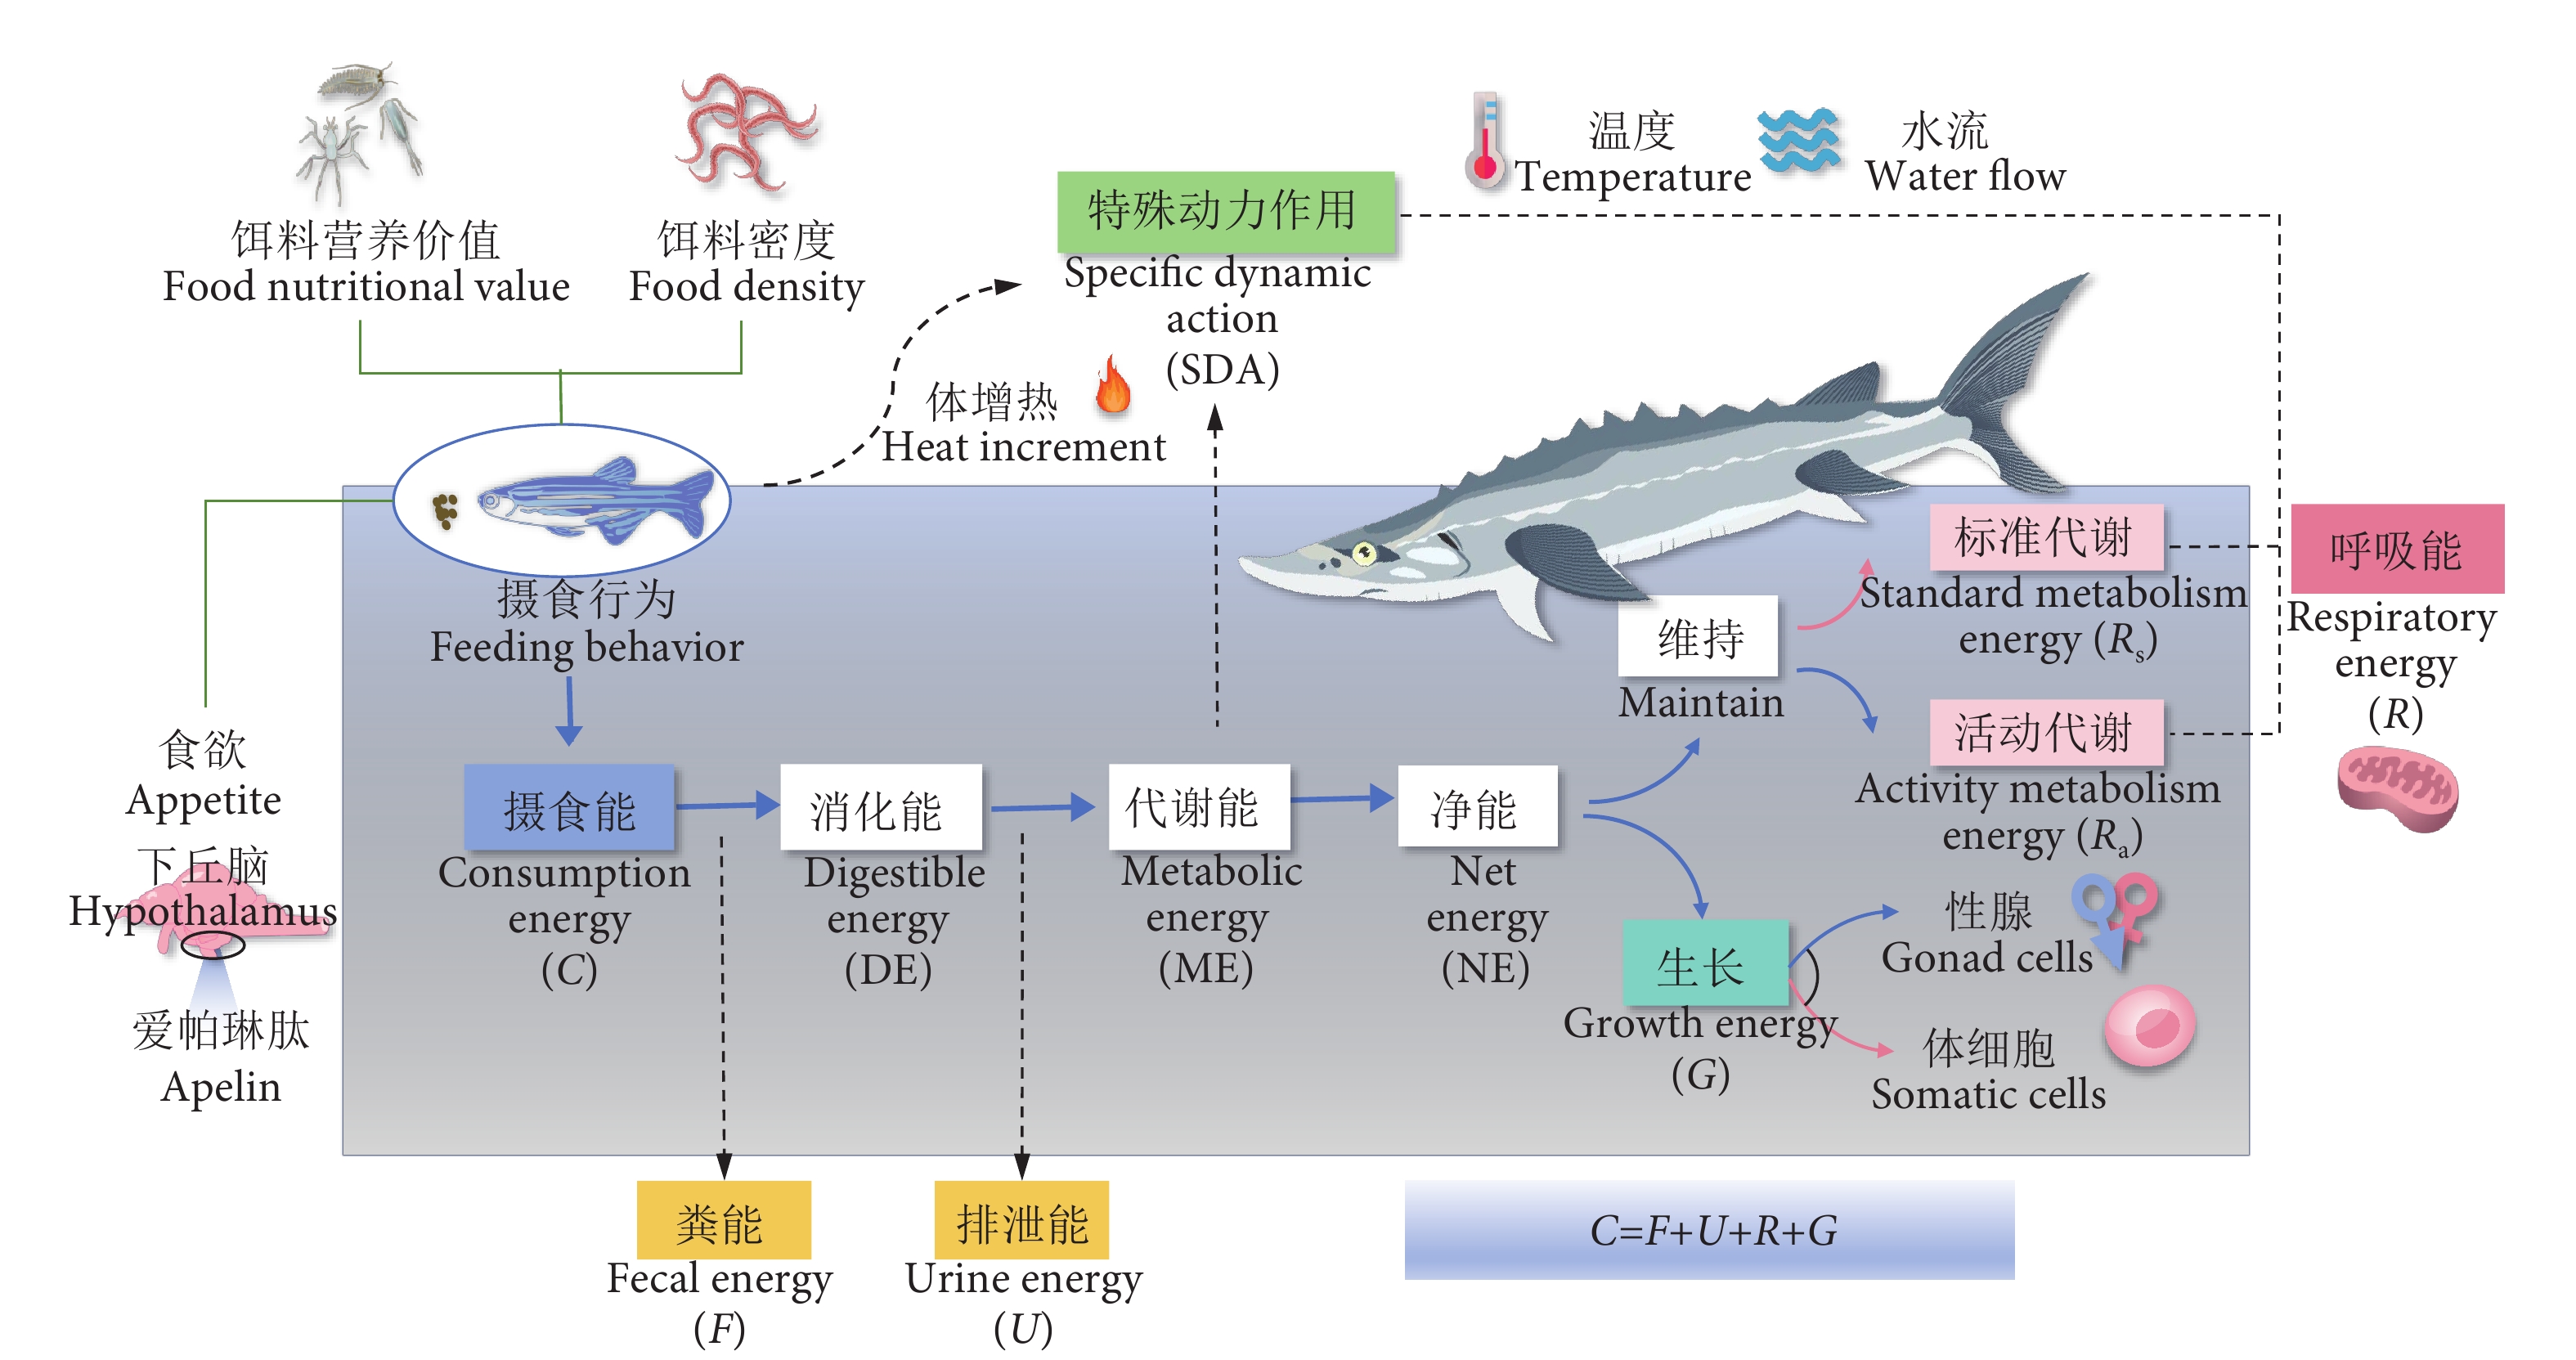
图 1 鱼类能量流概念图
注:参照崔奕波[4]。摄食能为从食物获取的能量;粪能为粪便中损失的能量;消化能为饲料可消化养分所含的能量;排泄能为氮排泄物中损失的能量;代谢能为建设自身或维持生命活动的能量;净能为代谢能减去体增热 (热增耗) 能后的能量;呼吸能为呼吸耗能;生长能为鱼体贮存能量;特殊动力作用为与食物消化有关的摄食热增能;标准代谢能为在饥饿、静止状态下的能量消耗;运动代谢能为与游泳等活动有关的能量消耗;Apelin为下丘脑释放调控鱼类食欲的激素。
Figure 1. Concept map of fish energy flow
Note: Referenced to Cui[4]. Consumption energy (C) is the energy obtained from food; fecal energy (F) is the energy lost through feces; digestible energy (DE) is the energy contained in the digestible nutrients of the feed; urine energy (U) is the energy lost through nitrogenous waste; metabolic energy (ME) is the energy used for growth and maintaining vital activities; net energy (NE) is the energy remaining after subtracting the heat increment of feeding (Heat increment) from the metabolic energy; respiratory energy (R) is the energy consumed for respiration; growth energy (G) is the energy stored in the fish body; specific dynamic action (SDA) is the heat increment of feeding related to the digestion of food; standard metabolism energy (Rs) is the energy consumption in a state of hunger and rest; activity metabolism energy (Ra) is the energy consumption related to activities such as swimming; Apelin is a hormone released by the hypothalamus that regulates the appetite of fish.
-
[1] FAO. The state of world fisheries and aquaculture 2022[R]. Rome: FAO, 2022: 4-6.
[2] 农业农村部渔业渔政管理局, 全国水产技术推广总站, 中国水产学会. 2023中国渔业统计年鉴[M]. 北京: 中国农业出版社, 2023: 17-20. [3] 李纯厚, 齐占会. 中国渔业生态环境学科研究进展与展望[J]. 水产学报, 2023, 47(11): 132-147. [4] 崔奕波. 鱼类生物能量学的理论与方法[J]. 水生生物学报, 1989(4): 369-383. [5] HATZONIKOLAKIS Y, TSIARAS K, TSERPES G, et al. Investigating growth and reproduction of the Mediterranean swordfish Xiphias gladius through a full life cycle bioenergetics model[J]. Mar Ecol Prog Ser, 2021, 680: 51-77. doi: 10.3354/meps13861
[6] SCHNEIDER J E. Energy balance and reproduction[J]. Physiol Behav, 2004, 81(2): 289-317. doi: 10.1016/j.physbeh.2004.02.007
[7] WARREN C E, DAVIS G. Laboratory studies on the feeding, bioenergetics and growth of fish[M]//GERKIN S D. The biological basis of freshwater fish production. Oxford: Blackwell Scientific Publication, 1967: 175-214.
[8] IGAMBERDIEV A U. Toward the relational formulation of biological thermodynamics[J]. Entropy, 2024, 26(1): 43-58.
[9] SAOWAKOON S, SAOWAKOON K, JUTAGATE A, et al. Growth and feeding behavior of fishes in organic rice-fish systems with various species combinations[J]. Aquac Rep, 2021, 20: 100663. doi: 10.1016/j.aqrep.2021.100663
[10] da SILVEIRA E L, SEMMAR N, CARTES J E, et al. Methods for trophic ecology assessment in fishes: a critical review of stomach analyses[J]. Rev Fish Sci Aquac, 2020, 28(1): 71-106. doi: 10.1080/23308249.2019.1678013
[11] GÜL G, DEMIREL N. Ontogenetic shift in diet and trophic role of Raja clavata inferred by stable isotopes and stomach content analysis in the Sea of Marmara[J]. J Fish Biol, 2022, 101(3): 560-572. doi: 10.1111/jfb.15123
[12] JIANG R J, YANG F, CHEN F, et al. Assessing trophic interactions among three tuna species in the Solomon Islands based on stomach contents and stable isotopes[J]. Front Mar Sci, 2022, 9: 961990. doi: 10.3389/fmars.2022.961990
[13] VARELA J L, INTRIAGO K M, FLORES J C, et al. Feeding habits of juvenile yellowfin tuna (Thunnus albacares) in Ecuadorian waters assessed from stomach content and stable isotope analysis[J]. Fish Res, 2017, 194: 89-98. doi: 10.1016/j.fishres.2017.05.017
[14] BROWNSCOMBE J W. Telemetry-based spatial-temporal fish habitat models for fishes in an urban freshwater harbour[J]. Hydrobiologia, 2023, 850(8): 1779-1800. doi: 10.1007/s10750-023-05180-z
[15] BROWNSCOMBE J W, SHIPLEY O N, GRIFFIN L P, et al. Application of telemetry and stable isotope analyses to inform the resource ecology and management of a marine fish[J]. J Appl Ecol, 2022, 59(4): 1110-1121. doi: 10.1111/1365-2664.14123
[16] RUBIN A M, SEEBACHER F. Feeding frequency does not interact with BPA exposure to influence metabolism or behaviour in zebrafish (Danio rerio)[J]. Physiol Behav, 2024, 273: 114403. doi: 10.1016/j.physbeh.2023.114403
[17] 曾令清, 付成, 奚露, 等. 鳊幼鱼能量代谢和个性行为的个体变异及表型关联[J]. 生态学报, 2017, 37(14): 4807-4816. [18] 彭敏锐, 郑雪丽, 李平, 等. 温度和重复测定对秦岭细鳞鲑快速启动反应, 游泳性能及力竭后代谢特征的影响[J]. 生态学报, 2021, 41(6): 2505-2514. [19] YEUNG C, COPEMAN L A, MATTA M E, et al. Latitudinal variation in the growth and condition of juvenile flatfishes in the Bering Sea[J]. Estuar Coast Shelf S, 2021, 258: 107416. doi: 10.1016/j.ecss.2021.107416
[20] MORALES M M, FIECHTER J, FIELD J C, et al. Development and application of a bioenergetics growth model for multiple early life stages of an ecologically important marine fish[J]. Ecol Model, 2024, 488: 110575. doi: 10.1016/j.ecolmodel.2023.110575
[21] MULLER E B, LIKA K, NISBET R M, et al. Regulation of reproductive processes with dynamic energy budgets[J]. Funct Ecol, 2019, 33(5): 819-832. doi: 10.1111/1365-2435.13298
[22] STAVRAKIDIS-ZACHOU O, PAPANDROULAKIS N, LIKA K. A bioenergetics approach to modelling tolerance limits under acute thermal stress in farmed finfish[J]. Front Mar Sci, 2023, 10: 1173358. doi: 10.3389/fmars.2023.1173358
[23] RAPOSO A I G, SOARES F, NOBRE A, et al. Development of dynamic growth and body composition models for Nile tilapia (Oreochromis niloticus): an exploratory approach to protein and energy metabolism[J]. Aquaculture, 2024, 578: 740032. doi: 10.1016/j.aquaculture.2023.740032
[24] ALSHDAIFAT N F F, TALIB A Z, OSMAN M A. Improved deep learning framework for fish segmentation in underwater videos[J]. Ecol Inform, 2020, 59: 101121. doi: 10.1016/j.ecoinf.2020.101121
[25] DAN W, BAI M J, LI H J, et al. Modified kinetic energy feature-based graph convolutional network for fish appetite grading using time-limited data in aquaculture[J]. Front Mar Sci, 2022, 9: 1021688. doi: 10.3389/fmars.2022.1021688
[26] KONNERT G D P, GERRITS W J J, GUSSEKLOO S W S, et al. Balancing protein and energy in Nile tilapia feeds: a meta-analysis[J]. Rev Aquac, 2022, 14(4): 1757-1778. doi: 10.1111/raq.12671
[27] SERRANO E, LEFILLANCA J K, CARRASCO J, et al. Evaluation of Andean lupin (Lupinus mutabilis) seed meal as a dietary component on growth performance, feed utilization, nutrient digestibility, and liver histology of rainbow trout (Oncorhynchus mykiss) juveniles[J]. Aquac Rep, 2024, 34: 101919. doi: 10.1016/j.aqrep.2024.101919
[28] POLITIKOS D, SOMARAKIS S, TSIARAS K P, et al. Simulating anchovy's full life cycle in the northern Aegean Sea (eastern Mediterranean): a coupled hydro-biogeochemical-IBM model[J]. Prog Oceanogr, 2015, 138: 399-416. doi: 10.1016/j.pocean.2014.09.002
[29] MOLTÓ V, PALMER M, OSPINA-ÁLVAREZ A, et al. Projected effects of ocean warming on an iconic pelagic fish and its fishery[J]. Sci Rep-UK, 2021, 11(1): 1-11. doi: 10.1038/s41598-020-79139-8
[30] 邓悦, 郑一琛, 常剑波. 利用Ecopath模型评价鲢鳙放养对千岛湖生态系统的影响[J]. 生态学报, 2022, 42(16): 6853-6862. [31] PAPANTONIOU G, ZERVOUDAKI S, ASSIMAKOPOULOU G, et al. Ecosystem-level responses to multiple stressors using a time-dynamic food-web model: the case of a re-oligotrophicated coastal embayment (Saronikos Gulf, E Mediterranean)[J]. Sci Total Environ, 2023, 903: 165882. doi: 10.1016/j.scitotenv.2023.165882
[32] GEARY W L, BODE M, DOHERTY T S, et al. A guide to ecosystem models and their environmental applications[J]. Nat Ecol Evol, 2020, 4(11): 1459-1471. doi: 10.1038/s41559-020-01298-8
[33] RODRIGUEZ-PEREZ A, TSIKLIRAS A C, GAL G, et al. Using ecosystem models to inform ecosystem-based fisheries management in Europe: a review of the policy landscape and related stakeholder needs[J]. Front Mar Sci, 2023, 10: 1196329. doi: 10.3389/fmars.2023.1196329
[34] COLL M, BELLIDO J M, PENNINO M G, et al. Retrospective analysis of the pelagic ecosystem of the Western Mediterranean Sea: drivers, changes and effects[J]. Sci Total Environ, 2024, 907: 167790. doi: 10.1016/j.scitotenv.2023.167790
[35] HAMZA F, M A, VALSALA V, et al. A bioenergetics model for seasonal growth of Indian oil sardine (Sardinella longiceps) in the Indian west coast[J]. Ecol Model, 2021, 456: 109661. doi: 10.1016/j.ecolmodel.2021.109661
[36] HEINICHEN M, MCMANUS M C, LUCEY S M, et al. Incorporating temperature-dependent fish bioenergetics into a Narragansett Bay food web model[J]. Ecol Model, 2022, 466: 109911. doi: 10.1016/j.ecolmodel.2022.109911
[37] 罗玉莲, 庞旭, 刘蒨莹, 等. 中华倒刺鲃幼鱼能量代谢特征个体差异及生态关联[J]. 水生生物学报, 2022, 46(6): 820-825. [38] 史东杰, 王文峰, 李文通, 等. 5种光周期对锦鲤生长、能量收支及生物钟基因表达的影响[J]. 水生生物学报, 2022, 46(5): 664-670. [39] 聂国兴, 邓大鹏, 闫潇. Apelin 与鱼类摄食[J]. 水产学报, 2020, 44(11): 1926-1934. [40] 王书磊, 周宇, 朱雪梅. 几种因子对鱼类能量收支影响的研究进展[J]. 中国渔业质量与标准, 2012, 2(4): 61-67. [41] SILVA-GARAY L, LOWE C G. Effects of temperature and body-mass on the standard metabolic rates of the round stingray, Urobatis halleri (Cooper, 1863)[J]. J Exp Mar Biol Ecol, 2021, 540: 151564. doi: 10.1016/j.jembe.2021.151564
[42] SCHULTE P. The effects of temperature on aerobic metabolism: towards a mechanistic understanding of the responses of ectotherms to a changing environment[J]. J Exp Biol, 2015, 218: 1856-1866. doi: 10.1242/jeb.118851
[43] WEN B, JIN S R, CHEN Z Z, et al. Plasticity of energy reserves and metabolic performance of discus fish (Symphysodon aequifasciatus) exposed to low-temperature stress[J]. Aquaculture, 2017, 481: 169-176. doi: 10.1016/j.aquaculture.2017.09.002
[44] PHAM L P, NGUYEN M V, JORDAL A E O, et al. Metabolic rates, feed intake, appetite control, and gut transit of clownfish Amphiprion ocellaris exposed to increased temperature and limited feed availability[J]. Comp Biochem Phys A, 2022, 274: 111318. doi: 10.1016/j.cbpa.2022.111318
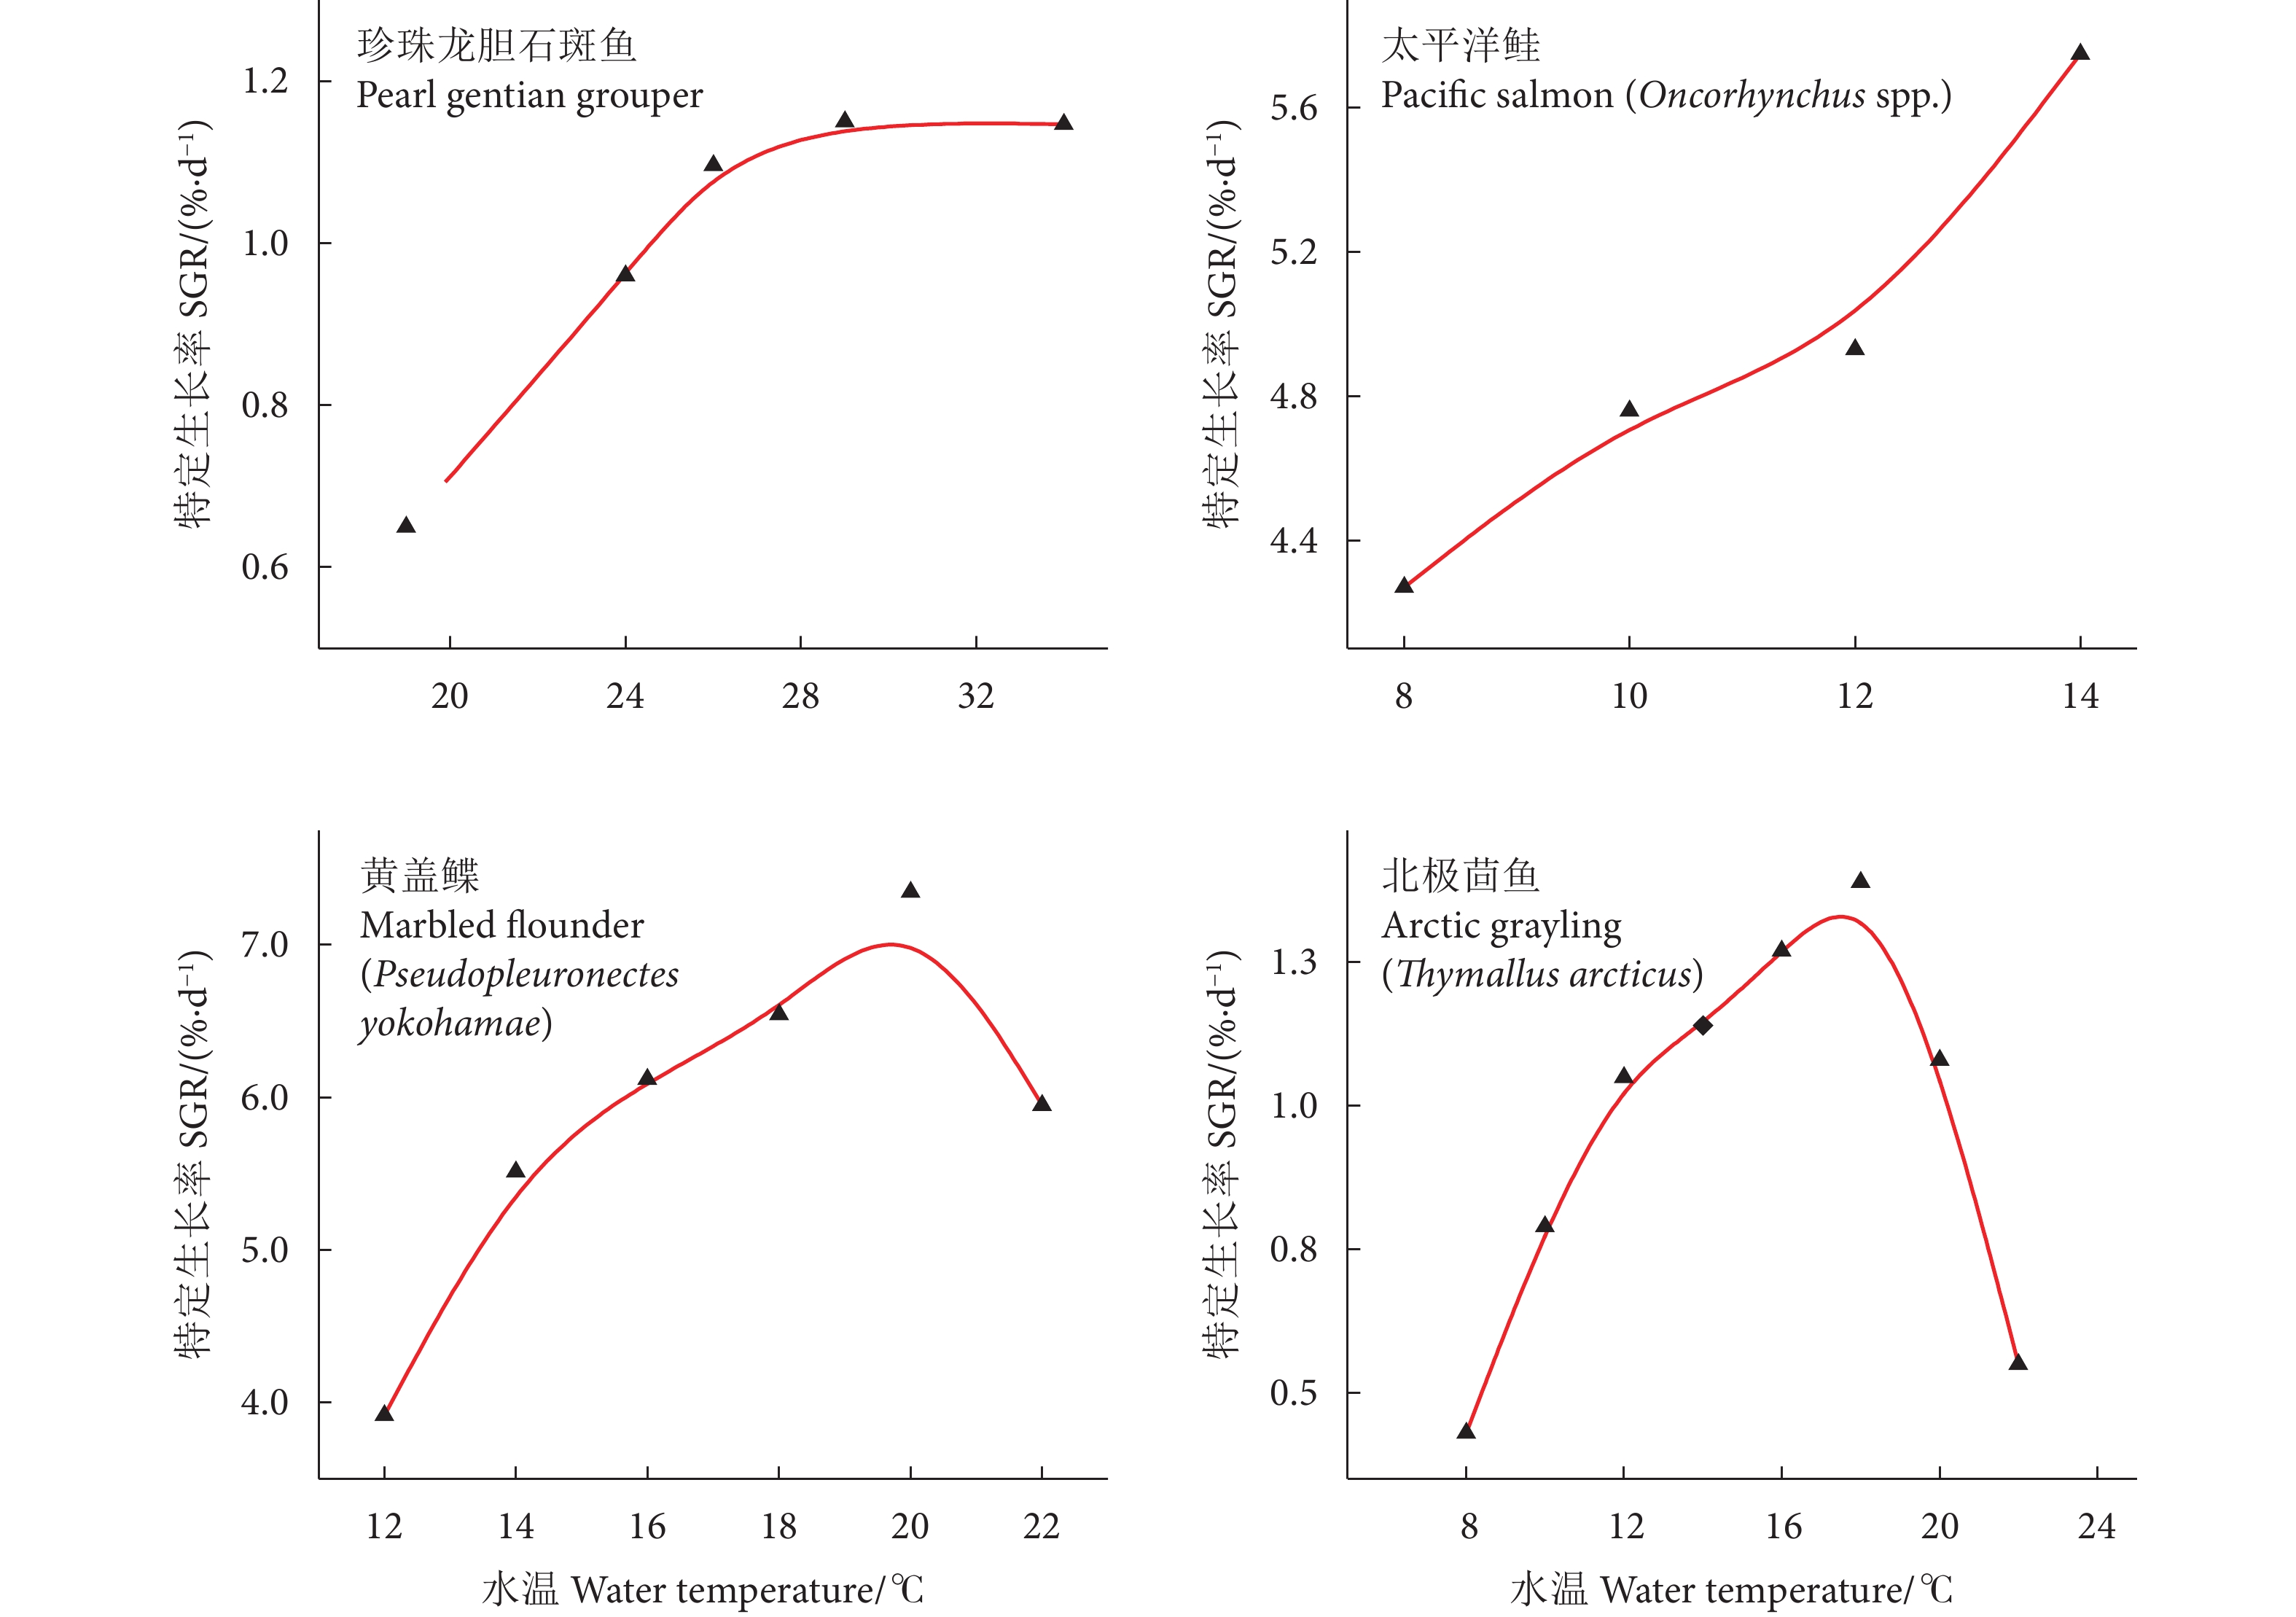
[45] 庞旭, 付世建, 刘小红, 等. 中华倒刺鲃能量代谢和热耐受特征的体重效应[J]. 生态学报, 2020, 40(16): 5814-5821. [46] ZHANG Z, YANG Z W, DING N, et al. Effects of temperature on the survival, feeding, and growth of pearl gentian grouper (female Epinephelus fuscoguttatus × male Epinephelus lanceolatus)[J]. Fish Sci, 2018, 84(2): 399-404. doi: 10.1007/s12562-017-1163-4
[47] IINO Y, KITAGAWA T, ABE T K, et al. Effect of food amount and temperature on growth rate and aerobic scope of juvenile chum salmon[J]. Fish Sci, 2022, 88(3): 397-409. doi: 10.1007/s12562-022-01599-w
[48] TOMIYAMA T, KUSAKABE K, OTSUKI N, et al. Ontogenetic changes in the optimal temperature for growth of juvenile marbled flounder Pseudopleuronectes yokohamae[J]. J Sea Res, 2018, 141: 14-20. doi: 10.1016/j.seares.2018.07.010
[49] CARRILLO-LONGORIA J A, GAYLORD G, ANDREWS L, et al. Effect of temperature on growth, survival, and chronic stress responses of Arctic grayling juveniles[J]. T Am Fish Soc, 2024, 153(1): 3-22. doi: 10.1002/tafs.10453
[50] 刘梅, 原居林, 练青平, 等. 不同流速对流水槽大口黑鲈生长性能、抗氧化能力、能量代谢及组织结构的影响[J]. 水生生物学报, 2023, 47(1): 25-36. [51] PALSTRA A P, ROQUE A, KRUIJT L, et al. Physiological effects of water flow induced swimming exercise in seabream Sparus aurata[J]. Front Physiol, 2020, 11: 610049. doi: 10.3389/fphys.2020.610049
[52] 代忠义, 高勤峰, 高永刚, 等. 不同水流速度对虹鳟生长性能、呼吸代谢及免疫相关酶活性的影响[J]. 中国海洋大学学报(自然科学版), 2023(3): 133-140. [53] SCHAKMANN M, KORSMEYER K E. Fish swimming mode and body morphology affect the energetics of swimming in a wave-surge water flow[J]. J Exp Biol, 2023, 226(6): jeb244739. doi: 10.1242/jeb.244739
[54] 汤保贵, 陈秀灿, 胡长圣, 等. 流速对黑鲷幼鱼游泳行为及运动生理的影响[J]. 水生生物学报, 2023, 47(12): 1993-2002. [55] TAN J H, LIU Z B, WANG Y, et al. Analysis of movements and behavior of bighead carps (Hypophthalmichthys nobilis) considering fish passage energetics in an experimental vertical slot fishway[J]. Animals, 2022, 12(13): 1725-1737. doi: 10.3390/ani12131725
[56] YANG M, GAO J, KE H, et al. Transcriptome-based analysis of the response mechanism of leopard coralgrouper liver at different flow velocities[J]. Fishes, 2022, 7(5): 279-290. doi: 10.3390/fishes7050279
[57] CASTEJÓN-SILVO I, TERRADOS J, NGUYEN T, et al. Increased energy expenditure is an indirect effect of habitat structural complexity loss[J]. Funct Ecol, 2021, 35(10): 2316-2328. doi: 10.1111/1365-2435.13876
[58] WU Y B, REN X, ZHOU J H, et al. Feed intake, growth, feed utilization, body composition and waste output of juvenile hybrid bream at different feeding frequencies[J]. Aquac Nutr, 2019, 25(2): 292-297. doi: 10.1111/anu.12852
[59] MCLEAN S, PERSSON A, NORIN T, et al. Metabolic costs of feeding predictively alter the spatial distribution of individuals in fish schools[J]. Curr Biol, 2018, 28(7): 1144-1149. doi: 10.1016/j.cub.2018.02.043
[60] BU X Y, LIAN X Q, ZHANG Y, et al. Effects of feeding rates on growth, feed utilization, and body composition of juvenile Pseudobagrus ussuriensis[J]. Aquac Int, 2017, 25(5): 1821-1831. doi: 10.1007/s10499-017-0156-8
[61] MENGISTU S B, MULDER H A, BENZIE J A H, et al. A systematic literature review of the major factors causing yield gap by affecting growth, feed conversion ratio and survival in Nile tilapia (Oreochromis niloticus)[J]. Rev Aquac, 2020, 12(2): 524-541. doi: 10.1111/raq.12331
[62] POUIL S, KERNÉIS T, QUILLET E, et al. Isogenic lines of rainbow trout (Oncorhynchus mykiss) as a tool to assess how growth and feeding behaviour are correlated to feed efficiency in fish[J]. Aquaculture, 2023, 577: 739904. doi: 10.1016/j.aquaculture.2023.739904
[63] FORSGREN E, AMUNDSEN T, BORG Å A, et al. Unusually dynamic sex roles in a fish[J]. Nature, 2004, 429(6991): 551-554. doi: 10.1038/nature02562
[64] KARJALAINEN J, URPANEN O, KESKINEN T, et al. Phenotypic plasticity in growth and fecundity induced by strong population fluctuations affects reproductive traits of female fish[J]. Ecol Evol, 2016, 6(3): 779-790. doi: 10.1002/ece3.1936
[65] HORNE C R, HIRST A G, ATKINSON D. Selection for increased male size predicts variation in sexual size dimorphism among fish species[J]. P Roy Soc B-Biol Sci, 2020, 287(1918): 20192640.
[66] PAULY D, OZYNSKI C C, STERGIOU K I. Interactions between growth, sex, reproduction and activity levels in control and fast-growing strains of Nile tilapia, Oreochromis niloticus[J]. Fish Centre Res Rep, 2017, 25(1): 12-30.
[67] PAULY D. Female fish grow bigger: let's deal with it[J]. Trends Ecol Evol, 2019, 34(3): 181-182. doi: 10.1016/j.tree.2018.12.007
[68] CYR B A D, TVEITEN H, VANDENBERG G W, et al. Characterization of the growth rate of adult wolffishes Anarhichas minor and A. lupus: is avoidance of paternal care at the origin of the expression of a sexual size dimorphism?[J]. Aquaculture, 2018, 497: 24-31. doi: 10.1016/j.aquaculture.2018.07.028
[69] ABOU ANNI I S, BIANCHINI A, BARCAROLLI I F, et al. Salinity influence on growth, osmoregulation and energy turnover in juvenile pompano Trachinotus marginatus Cuvier 1832[J]. Aquaculture, 2016, 455: 63-72. doi: 10.1016/j.aquaculture.2016.01.010
[70] SEALE A P, BREVES J P. Endocrine and osmoregulatory responses to tidally-changing salinities in fishes[J]. Gen Comp Endocr, 2022, 326: 114071. doi: 10.1016/j.ygcen.2022.114071
[71] HUANG J S, LI H J, GUO Z X, et al. Identification and expression analysis of cobia (Rachycentron canadum) liver-related miRNAs under hypoxia stress[J]. Fish Physiol Biochem, 2021, 47(6): 1951-1967. doi: 10.1007/s10695-021-01017-5
[72] MESSINA-HENRÍQUEZ S, AGUIRRE Á, BROKORDT K, et al. Swimming performance and physiological responses of juvenile Cojinoba Seriolella violacea in hypoxic conditions[J]. Aquaculture, 2022, 548: 737560. doi: 10.1016/j.aquaculture.2021.737560
[73] TROIA M J, PERKIN J S. Can fisheries bioenergetics modelling refine spatially explicit assessments of climate change vulnerability?[J]. Conserv Physiol, 2022, 10(1): coac035. doi: 10.1093/conphys/coac035
[74] SCHIETTEKATTE N M D, BRANDL S J, CASEY J M, et al. Biological trade-offs underpin coral reef ecosystem functioning[J]. Nat Ecol Evol, 2022, 6(6): 701-708. doi: 10.1038/s41559-022-01710-5
[75] MCLEAN M. Functional trade-offs in fish communities[J]. Nat Ecol Evol, 2022, 6(6): 669-670. doi: 10.1038/s41559-022-01706-1
[76] SPURGEON J J, PEGG M A. Juvenile growth of a macrohabitat generalist tied to hydrological character of large-river system[J]. Freshwater Biol, 2017, 62(2): 291-302. doi: 10.1111/fwb.12867
[77] PHANG S C, STILLMAN R A, CUCHEROUSSET J, et al. FishMORPH: an agent-based model to predict salmonid growth and distribution responses under natural and low flows[J]. Sci Rep-UK, 2016, 6(1): 29414. doi: 10.1038/srep29414
[78] LESTER R E, POLLINO C A, CUMMINGS C R. Testing an environmental flow-based decision support tool: evaluating the fish model in the Murray Flow Assessment Tool[J]. Environ Modell Softw, 2019, 111: 72-93. doi: 10.1016/j.envsoft.2018.09.012
[79] RHOADES S J, CALDWELL T J, MCBAIN S, et al. Trout bioenergetics as a process-based tool to estimate ecological risk in a regulated river[J]. J Am Water Resour As, 2024, 60(2): 287-304. doi: 10.1111/1752-1688.13173
[80] CHAHID A, N'DOYE I, MAJORIS J E, et al. Model predictive control paradigms for fish growth reference tracking in precision aquaculture[J]. J Process Contr, 2021, 105: 160-168. doi: 10.1016/j.jprocont.2021.07.015
[81] ZHANG B, SHEN J, XIONG J H, et al. Influence of solution and operating conditions on the treatment of aquaculture wastewater using direct contact membrane distillation: ammonia rejection and membrane fouling[J]. Chem Eng J, 2023, 478: 147326. doi: 10.1016/j.cej.2023.147326
[82] 刘晓娟, 罗伟, 王春芳, 等. 运用生物能量学模型预测草鱼生长, 饲料需求和污染排放[J]. 水产学报, 2018, 42(6): 950-967. [83] MA H J, YE J Y, HUANG H, et al. Growth, nutrient retention, wastes output and nonspecific immunity of juvenile snakehead Channa argus in response to dietary zinc levels[J]. Aquac Res, 2022, 53(17): 6090-6097. doi: 10.1111/are.16082
 下载:
下载:


计量
- 文章访问数: 0
- HTML全文浏览量: 0
- PDF下载量: 0
 粤公网安备 44010502001741号
