
Interannual change in biological traits and exploitation rate of Decapterus maruadsi in Beibu Gulf
-
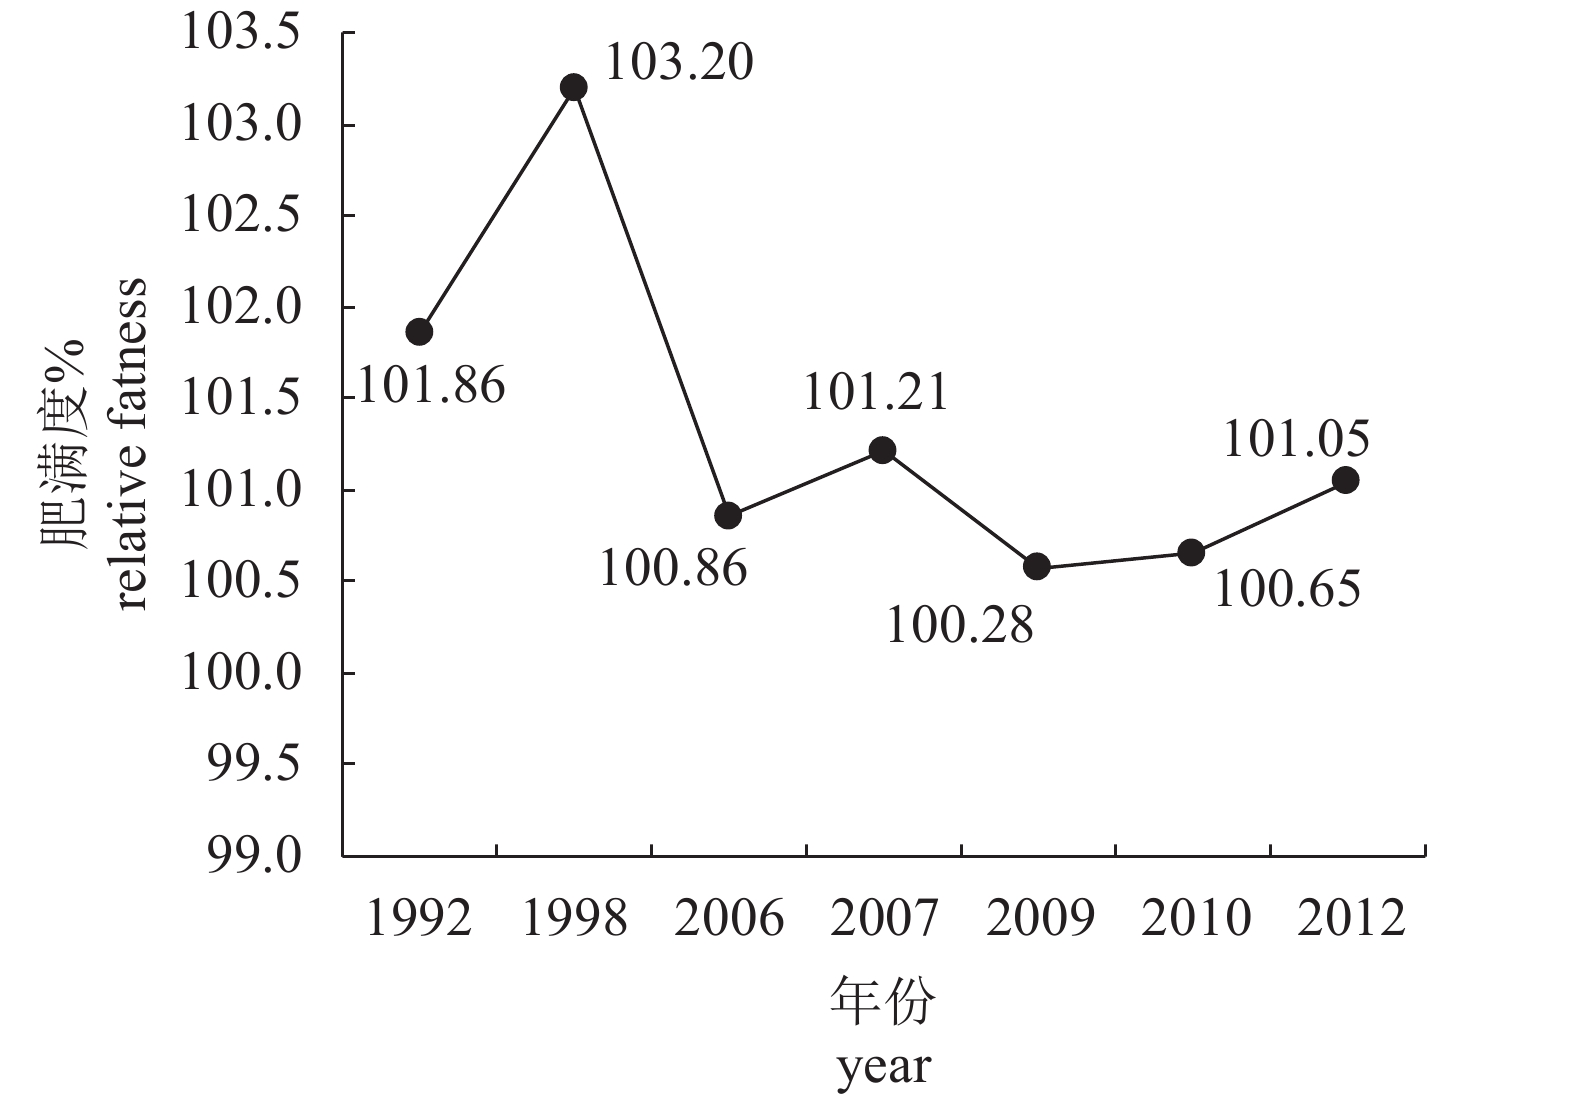
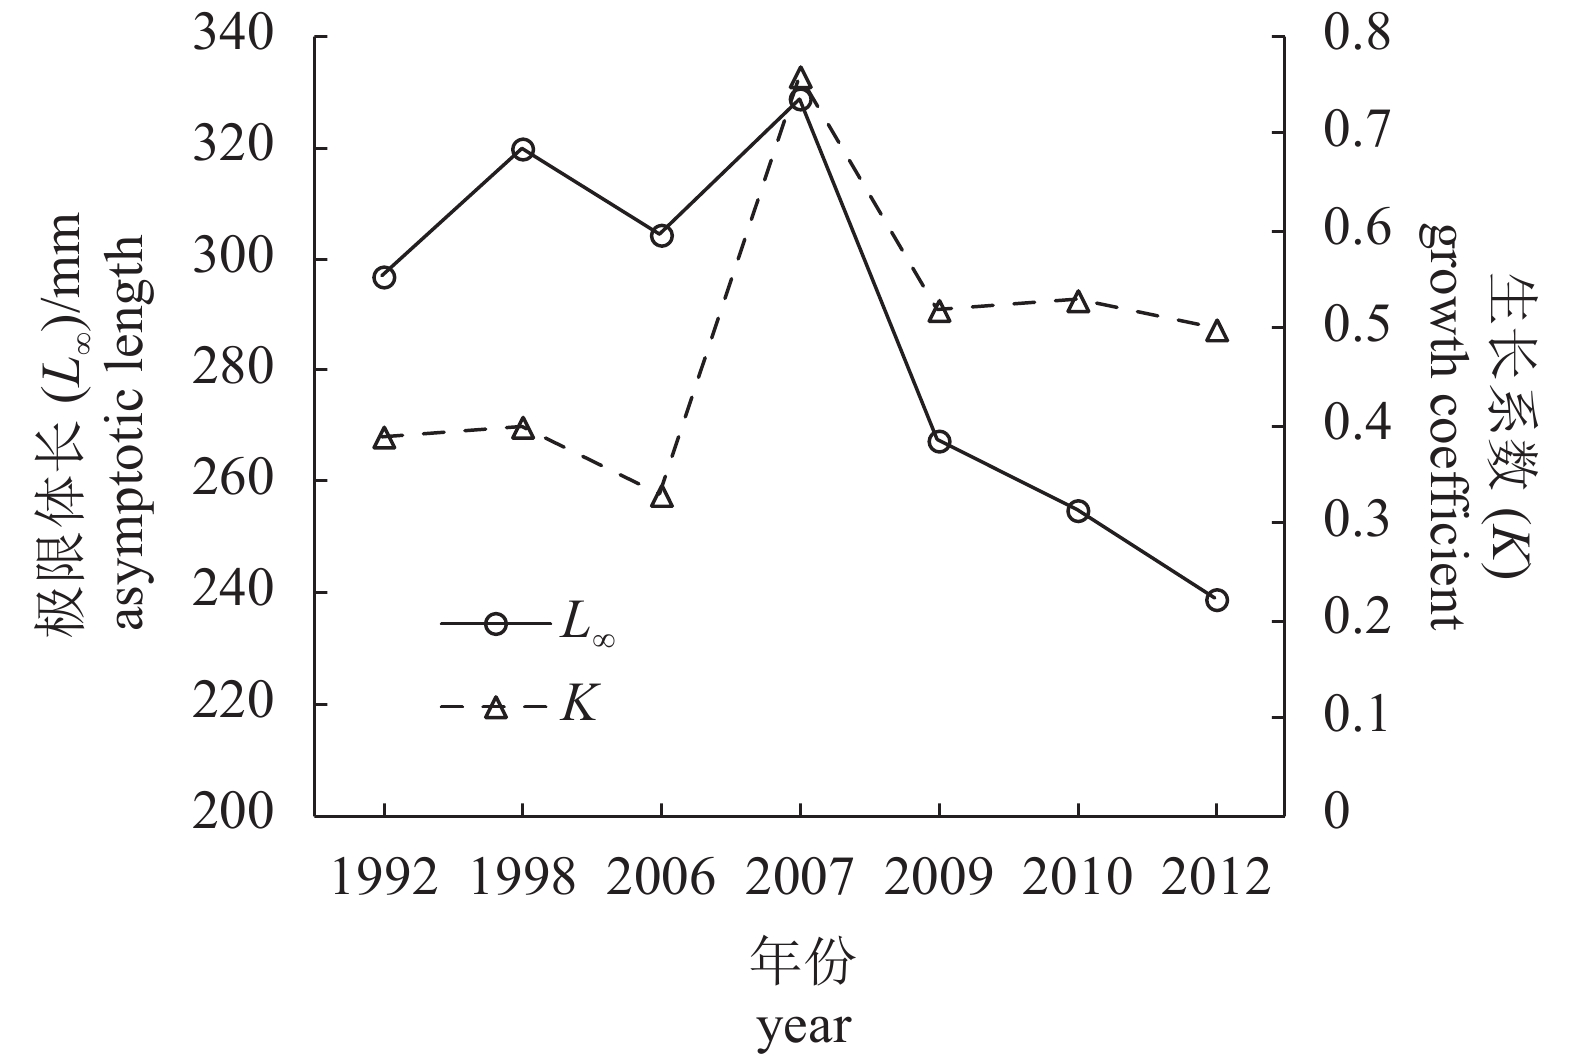
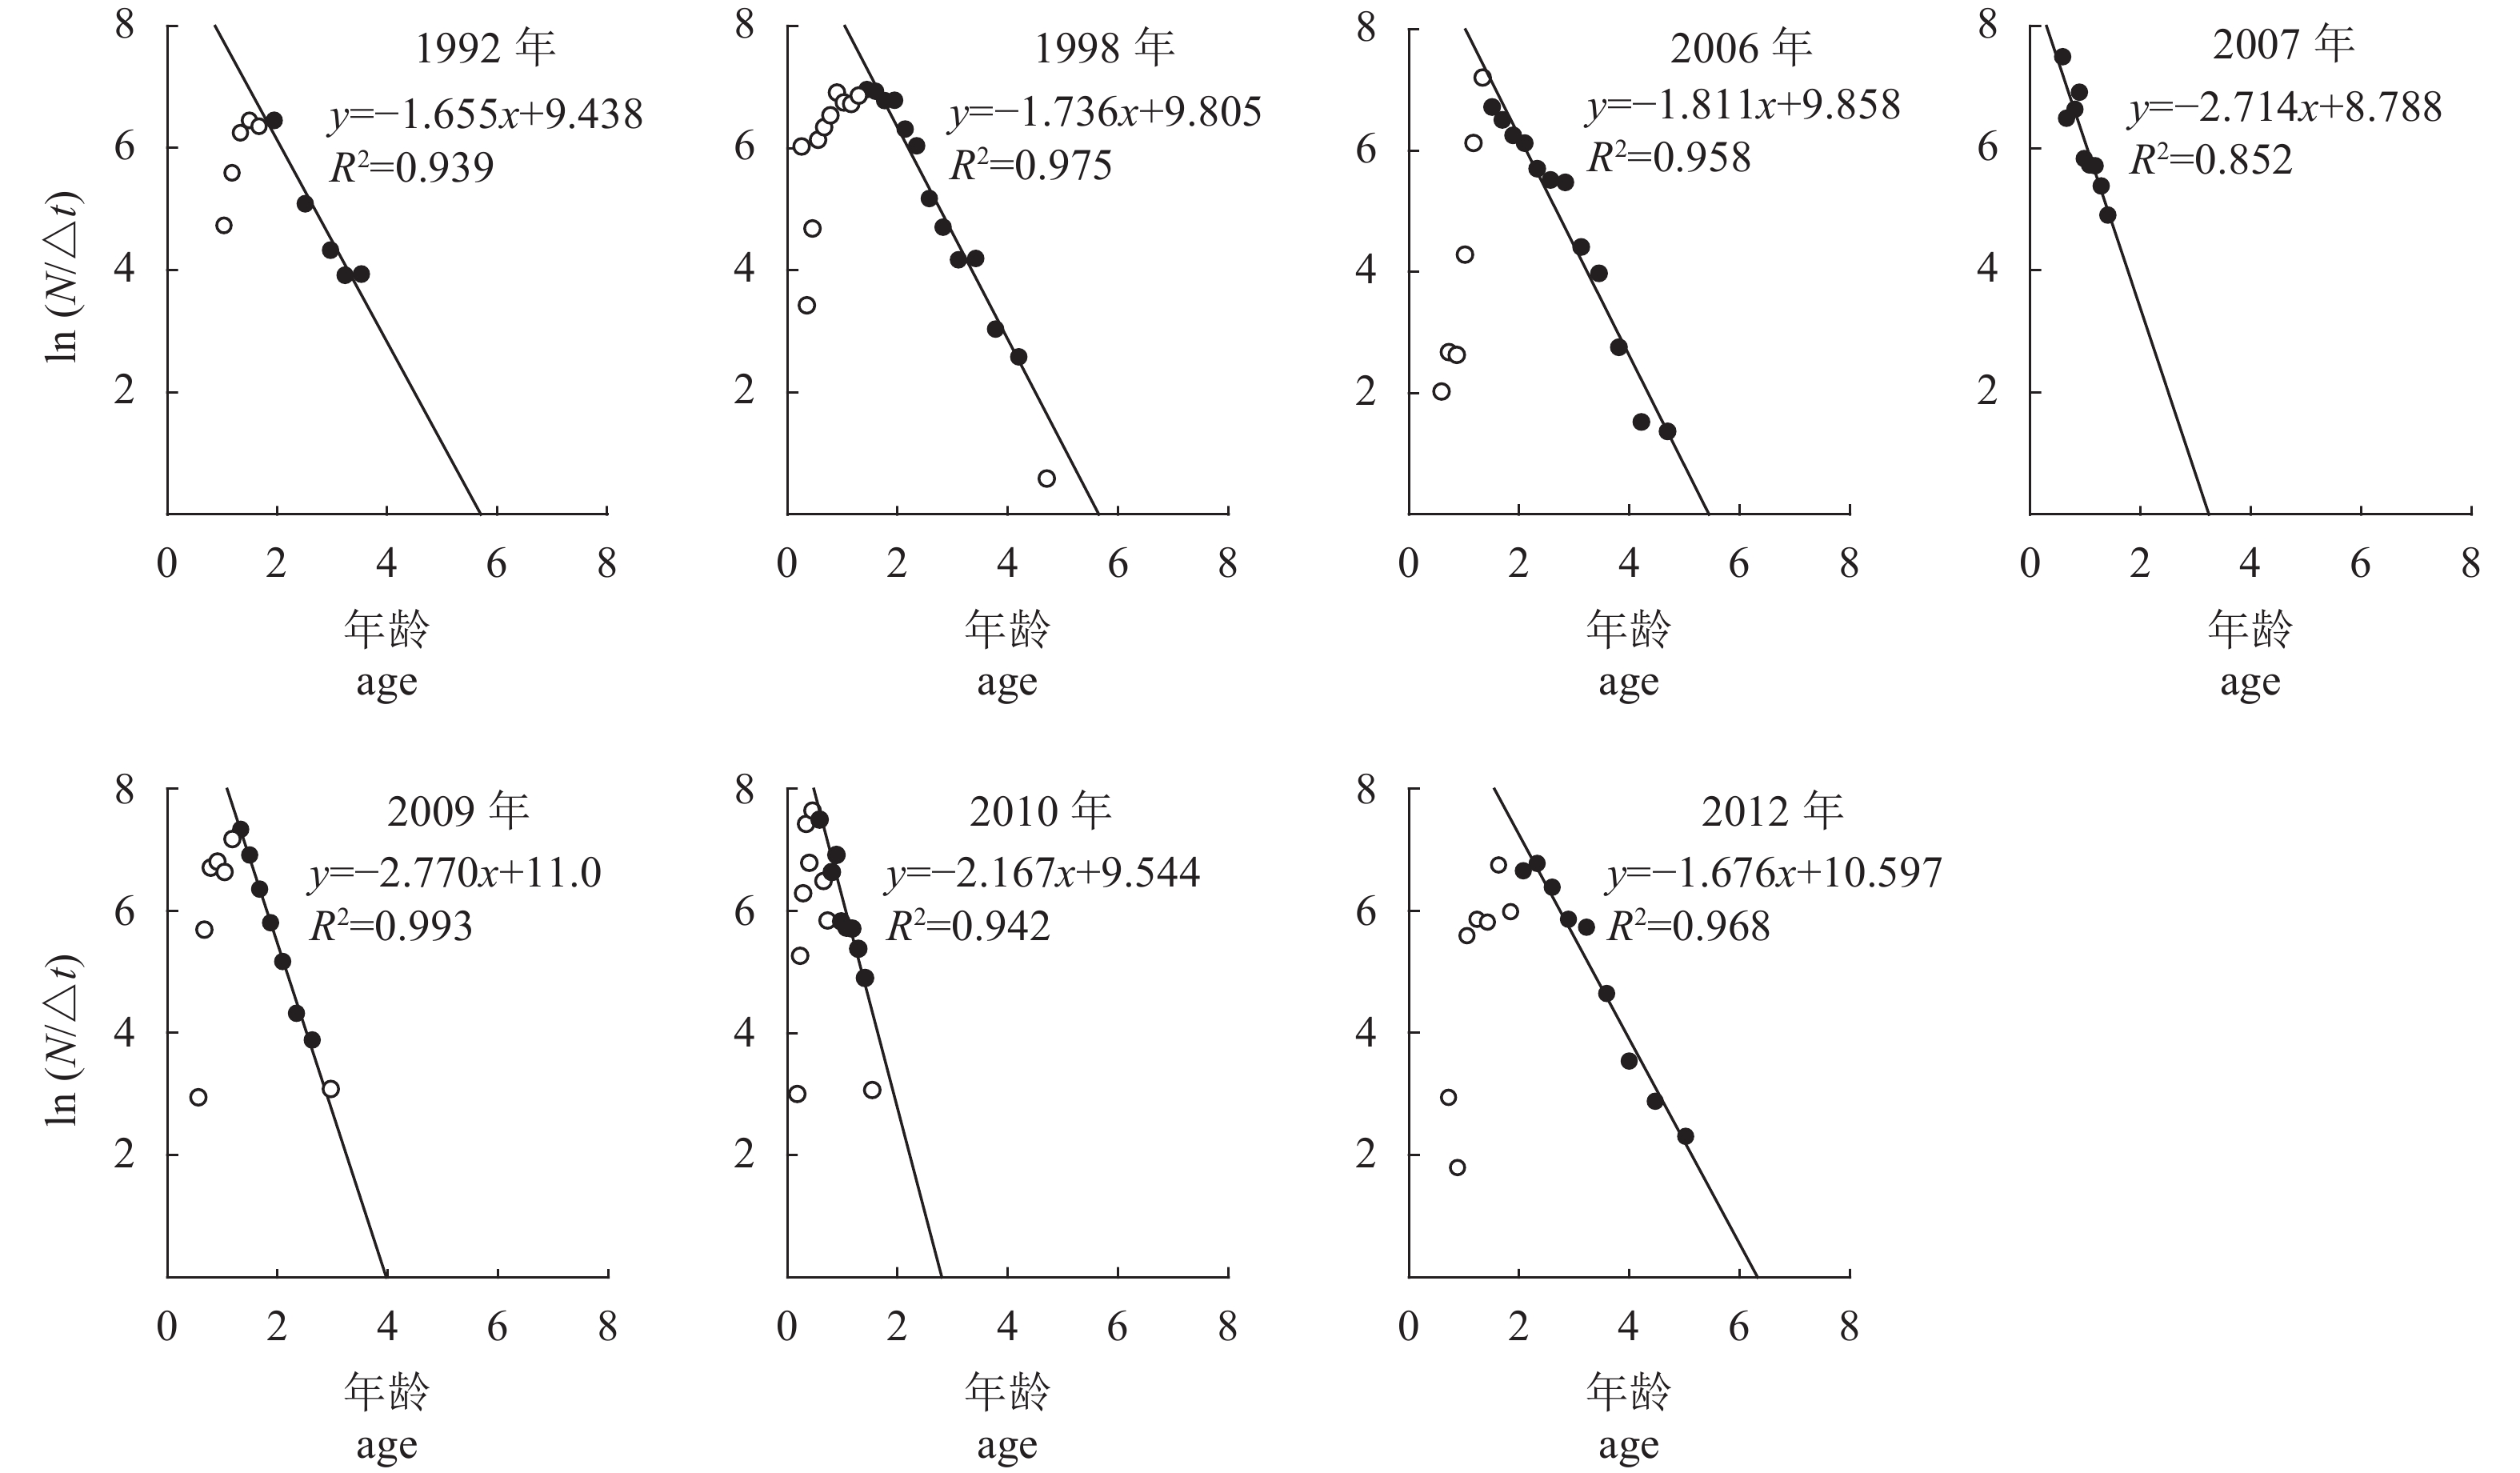
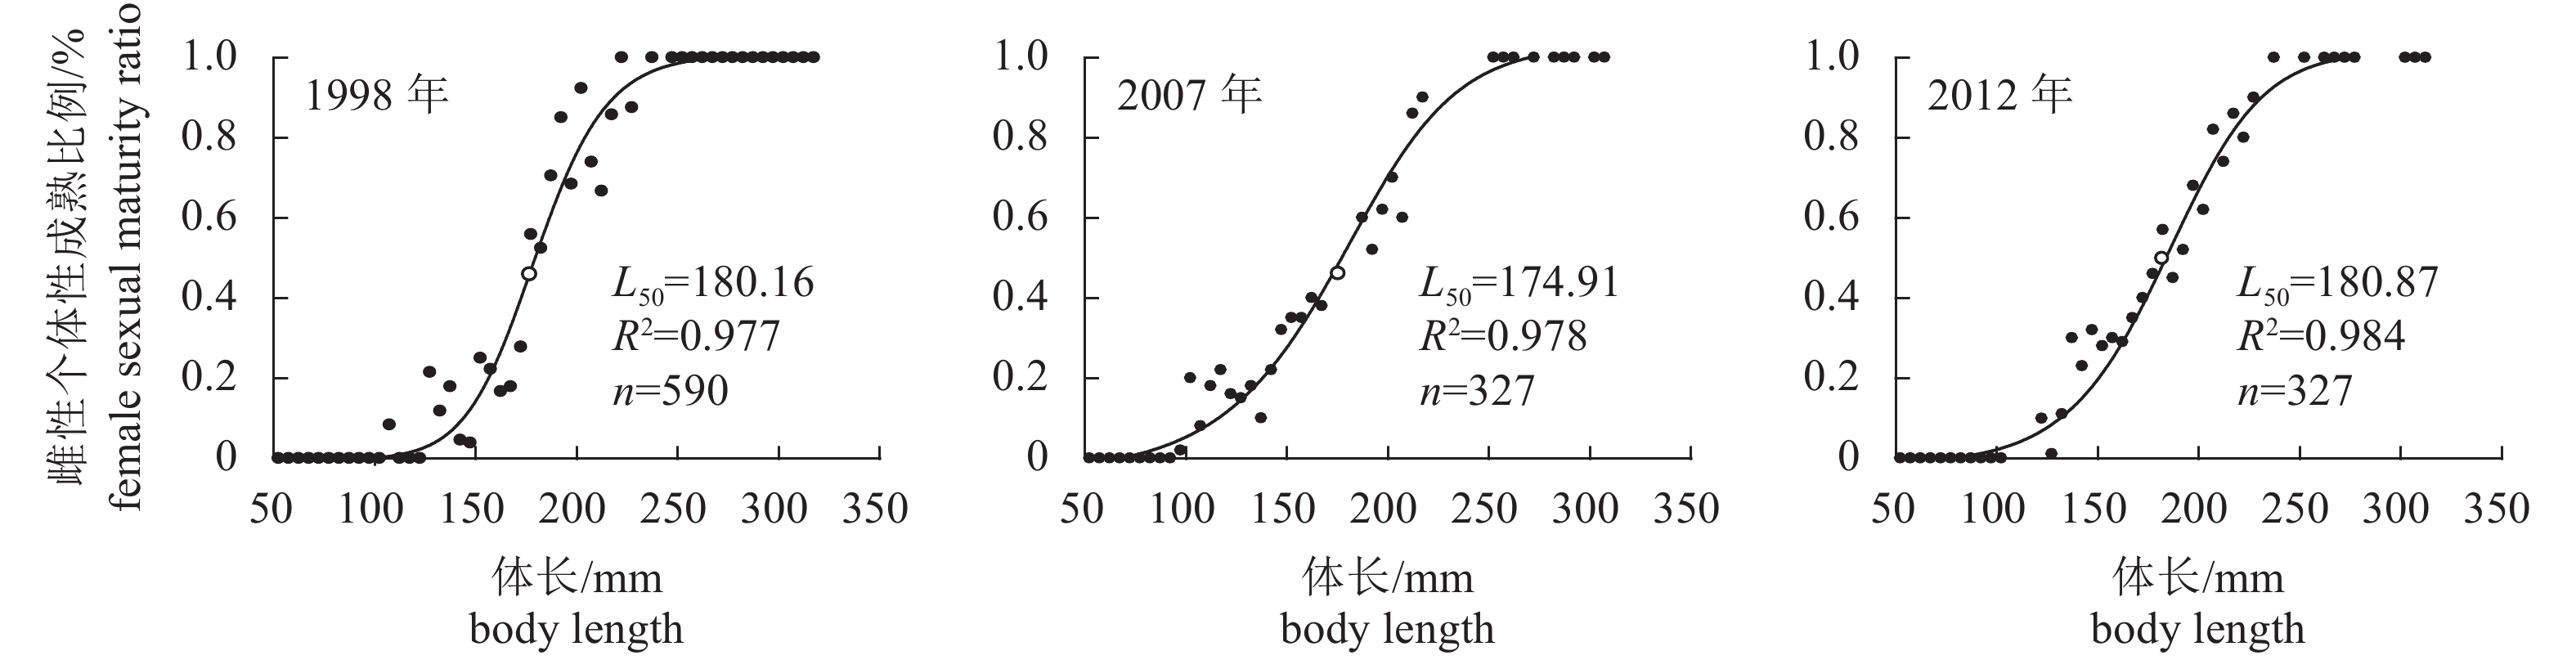
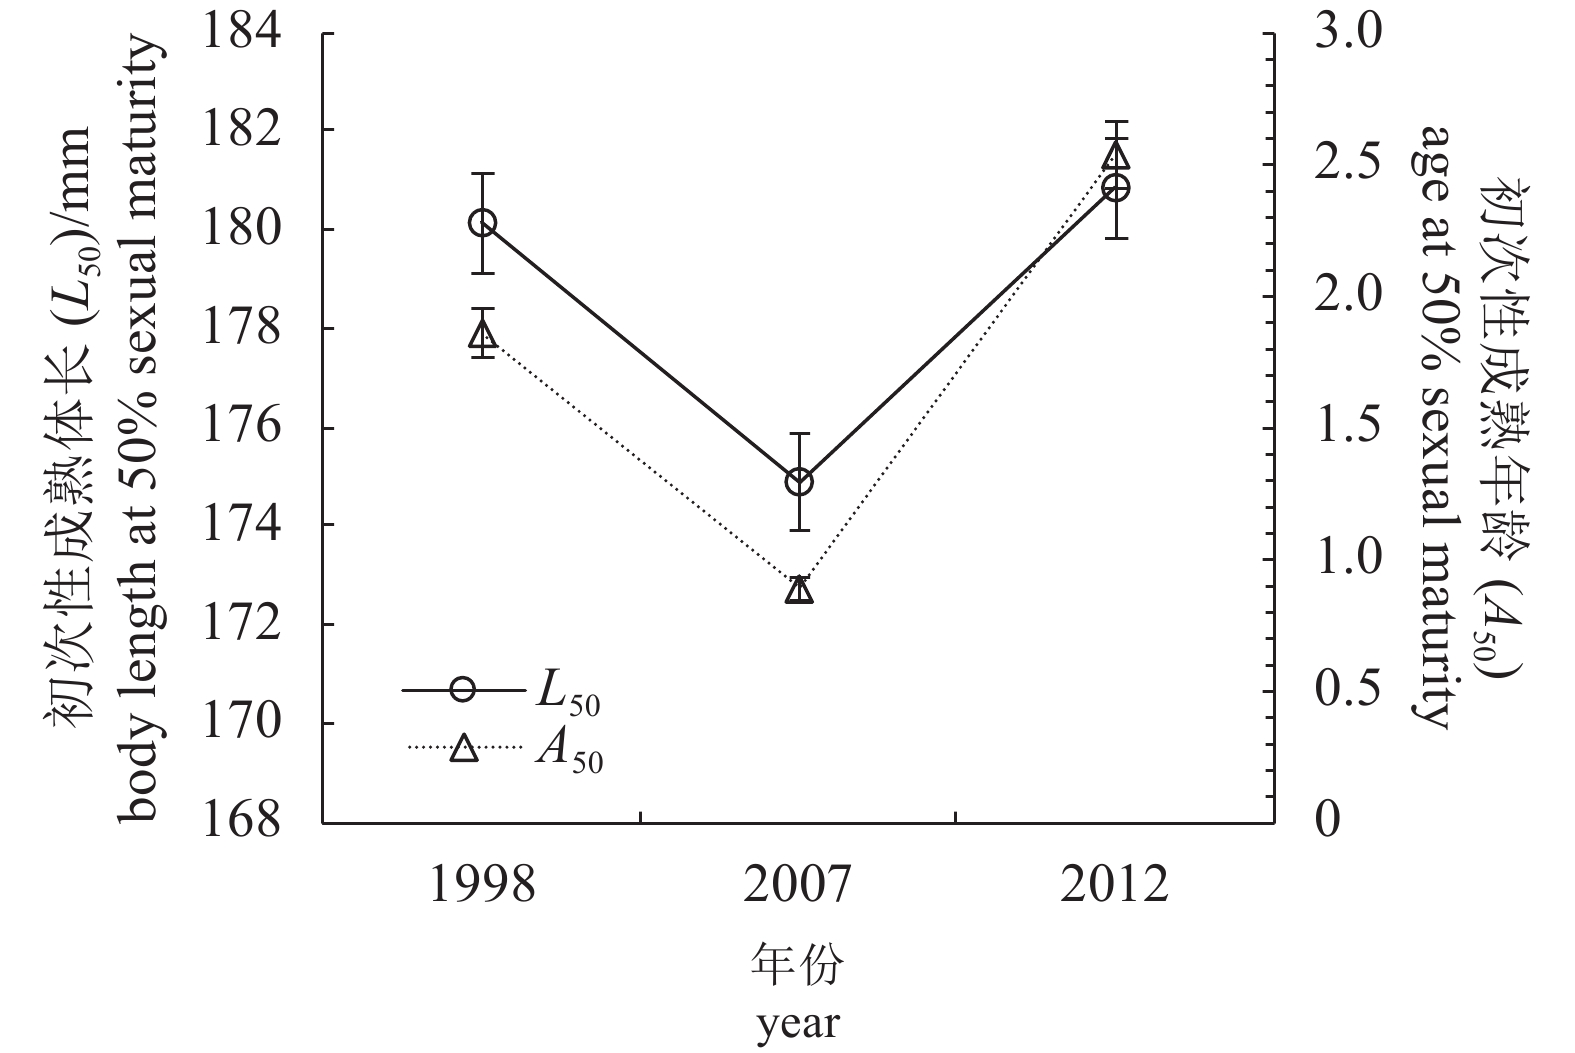
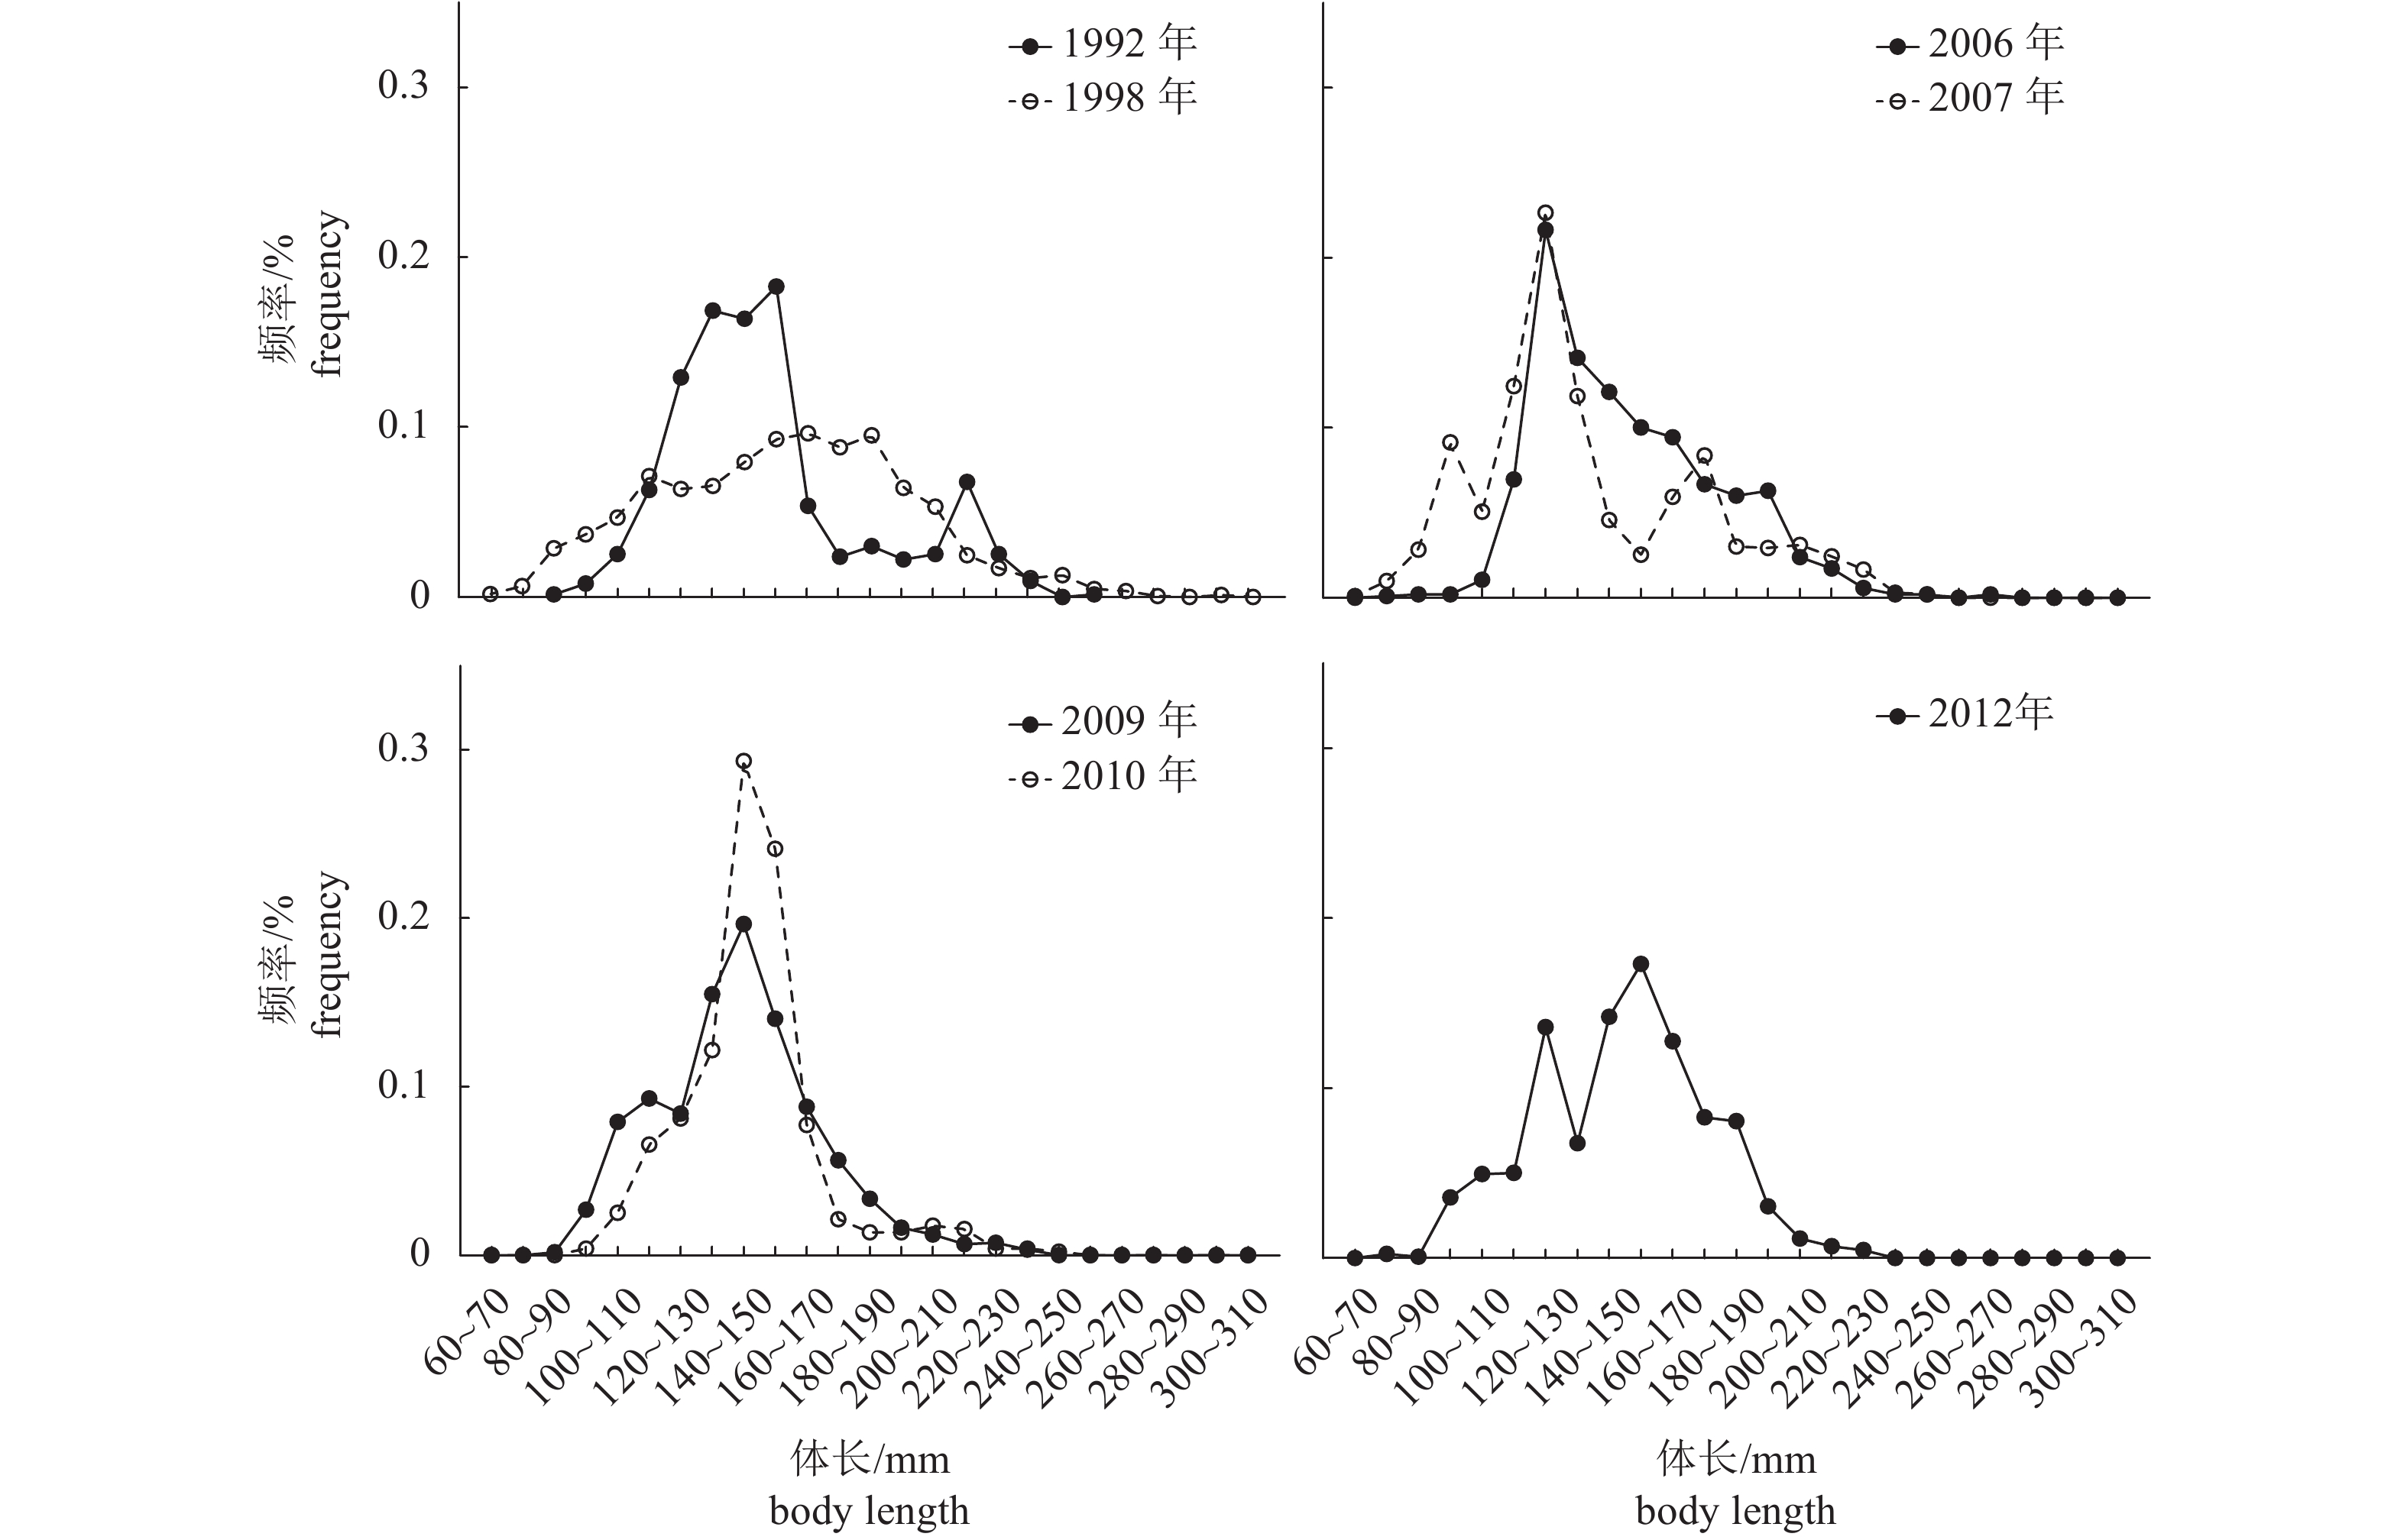
摘要: 根据1992—1993年(1992年)、1998—1999年(1998年)、2006年、2007年、2008—2009年(2009年)、2010年和2011—2012年(2012年) 7个时期的底拖网调查资料,对北部湾蓝圆鲹(Decapterus maruadsi)群体生物学特征及开发状态进行了评估。结果表明:1)蓝圆鲹优势体长组由1992年的130~170 mm减小为2007年的110~140 mm,随后有所回升,2012年为120~130 mm和140~170 mm;2)平均体长相比于1992年的160.23 mm,2007年只有139 mm,呈下降趋势,随后逐年回升,2012年为149 mm;3)初次性成熟体长(L50)以及初次性成熟年龄(A50)也呈类似变化趋势,L50和A50分别由1998年的180.16 mm和1.860减小为2007年的174.91 mm和0.888,之后回升至2012年的180.87 mm和2.538;4)生长系数(K)则从1992年的0.39上升至2007的0.76,之后逐年下降,2012年为0.5;5)总死亡系数(Z)自20世纪90年代起开始逐年升高,于2009年达到最高值(2.77),随后开始逐年降低,2012年降至1.68。开发率(E)也呈类似变化趋势,其中2010年的开发率与20世纪90年代初的相当。Abstract: We estimated the interannual change (size composition, growth, mortality and maturity in biological traits) of Decapterus maruadsi in Beibu Gulf based on the bottom trawls survey data during 1992−1993 (1992), 1998−1999 (1998), 2006, 2007, 2008−2009 (2009), 2010 and 2011−2013 (2012). Results show that: 1) The dominant body length groups decreased from 130−170 mm in 1992 to 110−140 mm in 2007, then showed an increasing trend, to 120−130 mm and 140 −170 mm in 2012. 2) The average body length decreased from 160.23 mm in 1992 to 139 mm in 2007, then increased to 149 mm in 2012. 3) The body length at 50% sexual maturity (L50) and age at 50% sexual maturity (A50) presented a similar trend with the average body length, decreasing from 180.16 mm and 1.860 in 1998 to 174.91 mm and 0.888 in 2007, respectively, then increased to 180.87 mm and 2.538 in 2012, respectively. 4) However, the growth coefficient (K) decreased gradually after increasing from 0.39 in 1992 to 0.72 in 2007, then decreased gradually to 0.5 in 2012. 5) The total mortality coefficient (Z) has been increased since the 1990s, reaching the maximum of 2.77 in 2009, then decreased to 1.68 in 2012. The variation trend of the exploitation rate (E) was similar with Z, and the E in 2010 was similar with that in early 1990s.
-
Keywords:
- Decapterus maruadsi /
- biological trait /
- exploitation rate /
- interannual change /
- Beibu Gulf
-
我国的珍珠贝主要包括珠母贝属(Pinctada) 的大珠母贝(P.maxima)、珠母贝(P.margaritifera)、黑珠母贝(P.nigra)、白珠母贝(P.albina)、合浦珠母贝(P.fucata)、长耳珠母贝(P.chemnitzi)和珍珠贝属的企鹅珍珠贝(Pteria penguin)等[1-2]。这些珍珠贝是生产海水珍珠的重要母贝或具有潜在的重要经济价值,其养殖业是广东、广西和海南最具特色的海洋产业,闻名遐尔的“南珠”即为其中的合浦珠母贝所产。但部分珍珠贝种类之间形态差异小,如射肋珠母贝和合浦珠母贝仅凭形态描述很难鉴定[2]。有的种形态变异大,不同栖息环境、不同发育阶段其形态特征均有所不同,分类鉴定容易出错,因此出现了很多同物异名[3]。幼体发育阶段的材料由于个体小,凭形态特征进行种类分类也容易混淆。此外,合浦珠母贝、长耳珠母贝和大珠母贝种间人工杂交中是真正的杂交,或是雌核发育的结果?目前只有同工酶的实验证据[4],尚无DNA方面的直接证据,由于同工酶是基因表达的产物,还不能完全说明杂交后代的身份性质。对于没有外部形态特征的样品,如肌肉或内脏团组织样品,如何鉴定?因此开发种类特异(species specific)的DNA分子标记对种类鉴定、分子标记辅助育种等方面具有重要的应用价值。
随机扩增多态性DNA(random amplified polymorphic DNA,RAPD)是1990年创建的一种DNA多态检测技术[5-6]。该技术具有简单快速和多态性较高等优点,已广泛运用于分类鉴定[7-11]与亲缘关系分析[12-14]、遗传多样性[15-16]和连锁图谱构建[17]等。阎冰等[18]对马氏珠母贝和长耳珠母贝进行了RAPD分析,发现两者扩增带型差异较大。喻达辉和朱嘉濠[19]对珠母贝属6个种的ITS2序列进行了分析,发现不同种间序列差异较大,但种内差异非常小,并且发现白珠母贝和黑珠母贝的序列差异也较小,认为它们可能是亚种,因此认为ITS2序列可以作为种间鉴别标记。由于DNA序列标记在应用上不是太方便,本文利用RAPD技术对7种珍珠贝进行遗传标记分析,筛选种类特异的、基于PCR的简单快速的分子标记,为种类鉴定、遗传育种等提供简单实用的遗传标记。
1. 材料和方法
1.1 实验材料
分析的种类包括珠母贝属的大珠母贝、珠母贝、黑珠母贝、白珠母贝、合浦珠母贝、长耳珠母贝和珍珠贝属的企鹅珍珠贝。其中白珠母贝采自澳大利亚,长耳珠母贝采自大亚湾,黑珠母贝和部分大珠母贝个体由中国科学院南海海洋研究所何毛贤博士惠赠,其它种采自海南三亚,采于2001年。各个种的个体数见表 1。每个个体取闭壳肌样品保存于95%的酒精中备用。
表 1 4条引物对7种珍珠贝RAPD扩增的条带数及各个种的条带数Table 1. The RAPD fragments amplified from the 7 pearl oyster species using 4 random primers种类(个体数)
species(no. of individuals)各引物的平均带数
average fragments per primer总平均带数
total mean fragmentsS10 S17 S358 OPM17 大珠母贝Pinctada maxima (5) 1.3(1~2) 5.0(4~6) 3.8(2~5) 1.3(1~2) 11.3(10~13) 珠母贝P.maritifera (3) 2.7(2~3) 5.0(4~6) 4.7(3~6) 3.0(2~4) 15.3(12~17) 黑珠母贝P.nigra (3) 2.0(1~2) 4.7(2~7) 1.3(0~3) 0.3(0~1) 8.3(4~13) 白珠母贝P.albina (3) 2.7(2~4) 3.7(3~4) 3.3(2~5) 2.7(2~4) 12.3(10~16) 合浦珠母贝P.fucata (11) 4.0(3~5) 3.8(3~5) 2.2(0~4) 1.8(1~4) 11.8(10~13) 长耳珠母贝P.chemnitzi (4) 3.0(2~4) 6.8(6~8) 1.5(1~2) 2.8(2~3) 14.0(11~17) 企鹅珍珠贝Pteria penguin (3) 2.0(1~3) 6.3(4~8) 1.7(1~2) 3.3(2~5) 13.3(9~17) 引物的平均扩增带数
total mean fragments/primer2.7(1~5) 5.0(2~8) 2.6(0~6) 2.1(1~5) 4.9(0~8) 1.2 模板DNA制备
每个个体DNA提取采用本实验室改进的方法,分别取20 mg左右的闭壳肌,放入1.5 mL离心管内,先加入100 μL TEN9细胞裂解缓冲液(Tris-Cl 50 mmol · L-1,pH 9.0;EDTA 100 mmol · L-1;NaCl 200 mmol · L-1),剪碎,再加入TEN9至600 μL,混匀后于56℃温浴5 min,加入SDS至终浓度为2%,混匀,56℃温浴15 min,加入蛋白酶K(20 mg · mL-1)10 μL,于56℃消化至溶液澄清。加入15 μL RNase A,37℃反应约15 min,冷却后用常规的酚、氯仿方法纯化,乙醇沉淀DNA,干燥后加入200 μL去离子超纯水溶解,4℃存放。提取的基因组DNA样品用1%琼脂糖凝胶电泳、EB染色检测,再测定OD260和OD280,检测DNA的质量和计算浓度,配成20 ng · μL-1的DNA备用。
1.3 RAPD扩增
RAPD反应总体积为25 μL, 包括:1× PCR Buffer, 0.2 mmol · L-1 dNTPs, 2.0 mmol · L-1 MgCl2, 0.25 μmol · L-1引物, 1U Taq DNA合成酶,20 ng DNA模板。PCR循环程序为:94℃变性5 min,然后45个循环,每个循环包括:94℃ 1 min,40℃ 1 min,72℃ 2 min。最后72℃延伸10 min。21条引物筛选出4条用于扩增分析。引物由Operon公司合成。4条引物序列为:S10:CTGCTGGGAC,S17:AGGGAACGAG,S358:TGGTCGCAGA,OPM17:TCGGTCCGGG。
1.4 扩增产物电泳检测
取10 μL扩增产物在1%琼脂糖凝胶上进行电泳分离(0.5×TBE,3 V · cm-1恒压),EB染色,用凝胶成像仪(SynGene)进行分析。
2. 结果
2.1 RAPD扩增结果
4条引物共扩增出57个位点,平均每条引物产生14.3个位点,其中S17和S358产生的位点数较多,分别为19和18个位点,S10和OPM17产生的位点较少,分别为9和11。种内每条引物产生的平均带数在0.3~6.8条之间(表 1),4条引物扩增的总带数平均为8.3~15.3条,片段大小在250~2 000 bp之间(图 1)。其中黑珠母贝4条引物扩增的总带数最少,平均为每个体8.3条(表 1)。种间每条引物平均扩增2.1~5.0条(表 1),其中,S17扩增的带最多,平均为每种5.0条,其余3条引物扩增的平均带数较接近,在2.1~2.7条之间。平均每种每条引物扩增的带数为4.9条。
![]() 图 1 引物S10在7种珍珠贝中的RAPD扩增结果M.分子量标记; 1~5.大珠母贝; 6~8.黑珠母贝; 9~11.珠母贝; 12~14.白珠母贝; 15~17.企鹅珍珠贝; 18~21.长耳珠母贝; 22~32.合浦珠母贝Figure 1. RAPD amplification result of the seven pearl oyster species using random primer S10M. DNA ladder; 1~5. Pinctada maxima; 6~8. P.nigra; 9~11. P.margaritifera; 12~14. P.albina; 15~17. Pteria penguin; 18~21. Pincata chemnitzi; 22~32. P.fucata
图 1 引物S10在7种珍珠贝中的RAPD扩增结果M.分子量标记; 1~5.大珠母贝; 6~8.黑珠母贝; 9~11.珠母贝; 12~14.白珠母贝; 15~17.企鹅珍珠贝; 18~21.长耳珠母贝; 22~32.合浦珠母贝Figure 1. RAPD amplification result of the seven pearl oyster species using random primer S10M. DNA ladder; 1~5. Pinctada maxima; 6~8. P.nigra; 9~11. P.margaritifera; 12~14. P.albina; 15~17. Pteria penguin; 18~21. Pincata chemnitzi; 22~32. P.fucata2.2 RAPD分子标记
S17、S358和OPM17引物可在部分种扩增出种类特异的带,可以将2种或2种以上的珍珠贝区别开来,而S10在7种珍珠贝中均可扩增出种类特异的一致性带1~2条(图 1,箭头所示),可作为所研究种类鉴别的分子标记。
研究用S10引物对大亚湾合浦珠母贝种群28个个体进行扩增发现,有3个个体的扩增谱带明显不同于合浦珠母贝(图 2),与图 1比较,与长耳珠母贝相同。其它个体在250 bp左右均有1条合浦珠母贝特有的一致的扩增带。
![]() 图 2 引物S10在合浦珠母贝群体扩增中检测到3个长耳珠母贝个体(10、17和24号个体)M.分子量标记;1~28.合浦珠母贝Figure 2. Three P.chemnitzi individuals(10, 17 and 24)were detected from P. fucata population using S10 primerm.DNA ladder;1~28.P.fucata
图 2 引物S10在合浦珠母贝群体扩增中检测到3个长耳珠母贝个体(10、17和24号个体)M.分子量标记;1~28.合浦珠母贝Figure 2. Three P.chemnitzi individuals(10, 17 and 24)were detected from P. fucata population using S10 primerm.DNA ladder;1~28.P.fucata3. 讨论
物种的鉴定,以往多根据经验的积累从其外形特征进行研究,进而发展到用生化指标(同工酶等)对物种进行鉴定。然而,这些方法所得到的标记往往是基因表达后的产物,受个体发育情况和外部环境条件的影响变化较大,容易产生误差。而DNA是与身俱来的遗传物质,具有很高的稳定性。因此DNA标记是揭示物种亲缘关系最有效的分子标记。随机扩增多态性DNA(RAPD)技术作为第二代分子标记具有简单、方便、快速、多态性较高等优点,是物种鉴定的首选标记[20]。CROSSLAND等[10]利用RAPD标记将Littorina的形态相似的2个姊妹种L.saxatilis和L.arcana很清楚地分开。KLINBUNGA等[11, 16]对泰国的5种牡蛎:Crassostrea belcheri, C.iredalei, Saccostrea cucullata, S.forskali和Striostrea mytiloides用RAPD技术进行了种类鉴定分析,结果发现C.belcheri, C.iredalei和S.cucullata能扩增出种类特异的带,而另外2种没有发现鉴别条带。可见同一条引物在多个种同时扩增出带并不十分容易。本研究通过采用RAPD技术筛选7种珍珠贝间的种类鉴定标记,4条引物中的1条引物S10可将所研究的7个种都分开,可作为种类鉴别标记。由于这7个种绝大部分都是我国的常见种,因此所获得的种间鉴别标记具有非常重要的实用价值。其它3条引物也可将部分种分开,其中S17可以将长耳珠母贝、合浦珠母贝、企鹅贝与其它贝区别开来,另外2条引物可以鉴别出2种或2种以上的珍珠贝。从扩增情况来看,每条引物扩增的带数并不多,但位点很多,说明不同种间扩增位点差异较大,表明RAPD技术在珍珠贝种类鉴定方面具有重要的开发价值。
-
![]()
图 1 北部湾蓝圆鲹7个时期的体长频率分布
Figure 1. Variation in length frequency of D. maruadsi in Beibu Gulf during seven periods
![]()
图 2 北部湾蓝圆鲹肥满度的年际变化
Figure 2. Interannual variation in relative fatness of D. maruadsi in Beibu Gulf
![]()
图 3 北部湾蓝圆鲹极限体长 (
$L_\infty $ ) 和生长系数 (K) 的年际变化Figure 3. Interannual variation in asymptotic length (
$L_\infty $ ) and growth coefficient (K) of D. maruadsi in Beibu Gulf![]()
图 4 根据渔获量曲线方法估算的北部湾蓝圆鲹总死亡系数
Figure 4. Length converted catch curve for D. maruadsi in Beibu Gulf
![]()
图 5 北部湾蓝圆鲹雌性个体性成熟比例观测值与ASR模型拟合的逻辑斯蒂曲线
Figure 5. Observed proportion of mature individuals and logistic curve fitted by ASR model of D. maruadsi in Beibu Gulf during three periods
![]()
图 6 蓝圆鲹雌性个体的初次性成熟体长 (L50) 与初次性成熟年龄 (A50) 的演变趋势
误差线为95%置信区间
Figure 6. Fluctuation in L50 and A50 of female D. maruadsi
Error bars show the 95% confidence interval.
表 1 北部湾蓝圆鲹7个时期的群体结构
Table 1 Population structure of D. maruadsi in Beibu Gulf during seven periods
年份
year尾数
ind.性比
sex ratio体长/mm body length 范围
distribution均值
mean优势组
dominant group1992 635 − 90~270 160.23 130~170 1998 1 714 0.48 32~300 155.29 160~170 2006 1 049 2.21 76~264 151 120~150 2007 1 028 2.6 67~250 139 110~140 2009 1 226 1.84 86~235 144 130~160 2010 465 0.656 96~215 144 130~160 2012 1 318 1.456 75~256 149 120~130;140~170  下载: 导出CSV
表 2 北部湾蓝圆鲹7个时期死亡参数的变化
Table 2 Total mortality coefficient, natural mortality coefficient, fishing mortality coefficient and exploitation of D. maruadsi in Beibu Gulf during seven periods
项目
item年份 year 1992 1998 2006 2007 2009 2010 2012 总死亡系数 (Z) total mortality coefficient 1.66 1.74 1.81 2.71 2.77 2.17 1.68 自然死亡系数 (M) natural mortality coefficient 0.49 0.49 0.44 0.74 0.61 0.63 0.62 捕捞死亡系数 (F) fishing mortality coefficient 1.17 1.25 1.37 1.97 2.16 1.54 1.06 开发率 (E) exploitation rate 0.7 0.72 0.76 0.73 0.78 0.71 0.63
下载: 导出CSV
-
[1] FAO. The state of world fisheries and aquaculture 2016 (Sofia): contributing to food security and nutrition for all[M]. Rome: Food and Agriculture Organization, 2016: 1-23.
[2] FAO. The state of world fisheries and aquaculture 2008[J]. State World Fish Aquacult, 2009, 4(1): 40-41.
[3] STOKES K, LAW R. Fishing as an evolutionary force[J]. Mar Ecol Prog, 2000, 208: 307-309.
[4] MYERS R, HUTCHINGS J, BARROWMAN N. Hypotheses for the decline of cod in the North Atlantic[J]. Mar Ecol Prog, 1996, 138(1): 293-308.
[5] JACKSON J C, KIRBY M X, BERGER W H, et al. Historical overfishing and the recent collapse of coastal ecosystems[J]. Science, 2001, 293(5530): 629-638.
[6] SUTHERLAND W J. Evolution and fisheries[J]. Nature, 1990, 344: 814-815.
[7] DIECKMANN U. Can adaptive dynamics invade?[J]. Trends Ecol Evol, 1997, 12(4): 128-131.
[8] MUDJIRAHAYU, BAWOLE R, REMBET U J, et al. Growth, mortality and exploitation rate of Plectropomus maculatus and P.oligocanthus (Groupers, Serranidae) on Cenderawasih Bay National Park, Indonesia[J]. Egy J Aquat Res, 2017, 43(3): 213-218.
[9] 陈作志, 邱永松, 贾晓平, 等. 捕捞对北部湾海洋生态系统的影响[J]. 应用生态学报, 2008, 19(7): 1604-1610. [10] 王雪辉, 邱永松, 杜飞雁, 等. 北部湾秋季底层鱼类多样性和优势种数量的变动趋势[J]. 生态学报, 2012, 32(2): 333-342. [11] 邹建伟, 林丕文, 王强哲. 南海北部湾2012年捕捞产量估算[J]. 南方水产科学, 2013, 9(4): 75-81. [12] 袁蔚文. 北部湾底层渔业资源的数量变动和种类更替[J]. 中国水产科学, 1995(2): 56-65. [13] 陈作志, 邱永松, 徐姗楠, 等. 北部湾花斑蛇鲻生物学特征的演化[J]. 中国水产科学, 2012, 19(2): 321-328. [14] 张魁, 陈作志, 王跃中, 等. 北部湾短尾大眼鲷群体结构及生长、死亡和性成熟参数估计[J]. 热带海洋学报, 2016, 35(5): 20-28. [15] 孙典荣, 邱永松. 北部湾短尾大眼鲷生长和死亡参数的估算[J]. 福建水产, 2003(1): 7-12. [16] 张魁, 陈作志, 邱永松. 北部湾二长棘犁齿鲷生长、死亡和性成熟参数的年际变化[J]. 南方水产科学, 2016, 12(6): 9-16. [17] 陈作志, 邱永松. 北部湾二长棘鲷生长和死亡参数估计[J]. 水产学报, 2003, 27(3): 251-257. [18] LAW R. Fishing, selection, and phenotypic evolution[J]. ICES J Mar Sci, 2000, 57(3): 659-668.
[19] 牛素芳, 苏永全, 王军, 等. 福建近海蓝圆鲹群体遗传结构分析[J]. 厦门大学学报(自然版), 2012, 51(4): 759-766. [20] 邓景耀. 海洋渔业生物学[M]. 北京: 农业出版社, 1991: 485. [21] 卢振彬, 戴泉水, 颜尤明. 台湾海峡及其邻近海域鲐鲹鱼类群聚资源的评估[J]. 中国水产科学, 2000, 7(1): 41-45. [22] 孙典荣, 林昭进. 北部湾主要经济鱼类资源变动分析及保护对策探讨[J]. 热带海洋学报, 2004, 23(2): 62-68. [23] 林学群. 粤东近海雄性条尾鲱鲤体长与体重关系研究[J]. 汕头大学学报(自然科学版), 1999, 14(2): 64-71. [24] 李忠炉, 金显仕, 单秀娟, 等. 小黄鱼体长-体质量关系和肥满度的年际变化[J]. 中国水产科学, 2011, 18(3): 602-610. [25] SEIYABOH E I, IZAH S C, GIJO A H. Length-weight relationship and condition factor of some important fish species from sangana river, Niger delta[J]. Int J Innov Agr Biol Res, 2016, 4(4): 37-44.
[26] NEHEMIA A, MAGANIRA J D, RUMISHA C. Length-weight relationship and condition factor of tilapia species grown in marine and fresh water ponds[J]. Agr Biol J N A, 2012, 3(3): 117-124.
[27] BOLGER T, CONNOLLY P L. The selection of suitable indices for the measurement and analysis of fish condition[J]. J Fish Biol, 1989, 34(2): 171.
[28] JONES R E, PETRELL R J, PAULY D. Using modified length-weight relationships to assess the condition of fish[J]. Aquacult Eng, 1999, 20(4): 261-276.
[29] FROESE R. Cube law, condition factor and weight-length relationships: history, meta-analysis and recommendations[J]. J Appl Ichthyol, 2006, 22(4): 241-253.
[30] 詹秉义. 渔业资源评估[M]. 北京: 农业出版社, 2005: 25-120. [31] PAULY D. Gill size and temperature as governing factors in fish growth: a generalization of von Bertalanffy's growth formula[C]//Berichte aus dem Institut für Meereskunde an der Christian-Albrechts-Universität Kiel, nr. 63, Kiel : D. Pauly, 1979: 1-136.
[32] PAULY D. On the interrelationships between natural mortality, growth-parameters, and mean environmental-temperature in 175 fish stocks[J]. J Du Conseil, 1980, 39(2): 175-192.
[33] CHEN Y, PALOHEIMO J E. Estimating fish length and age at 50% maturity using a logistic type model[J]. Aquat Sci, 1994, 56(3): 206-219.
[34] GULLAND J A. Fish stock assessment:a manual of basic methods[M]. New York: Wiley Online Library, 1983: 1-220.
[35] 张魁, 廖宝超, 许友伟, 等. 基于渔业统计数据的南海区渔业资源可捕量评估[J]. 海洋学报, 2017, 39(8): 25-33. [36] CONOVER D O, MUNCH S B. Sustaining fisheries yields over evolutionary time scales[J]. Science, 2002, 297(5578): 94-96.
[37] LAW R. Fishing, selection, and phenotypic evolution[J]. ICES J Mar Sci, 2000, 57(3): 659-668.
[38] HILBORN R, WALTERS C J. Quantitative fisheries stock assessment[M]. Routledge, Chapman & Hall, Inc. , 1992: 177-178.
[39] 张静, 姚壮, 林龙山, 等. 北部湾口和南沙群岛西南部海域主要渔获种类的生物学特征及其数量分布[J]. 中国海洋大学学报(自然科学版), 2016, 46(11): 158-167. [40] ENBERG K, JORGENSEN C, DUNLOP E S, et al. Fishing-induced evolution of growth: concepts, mechanisms and the empirical evidence[J]. Mar Ecol-Evol Persp, 2012, 33(1): 1-25.
[41] HAMLEY J M. Review of gillnet selectivity[J]. J De L'office Des Recherches Sur Les Pêcheries Du Canada, 1975, 32(11): 1943-1969.
[42] ERNANDE B, DIECKMANN U, HEINO M. Adaptive changes in harvested populations: plasticity and evolution of age and size at maturation[J]. Proc Biol Sci, 2004, 271(1537): 415-423.
[43] MERTZ G, MYERS R A. A simplified formulation for fish production[J]. Can J Fish Aquat Sci, 2011, 55(2): 478-484.
[44] NEJA Z. The stock, size and changes in the growth rate of the Northwest Atlantic mackerel (Scomber scombrus L.) in 1971-1983[J]. Acta Ichthyologica et Piscatoria, 1995, 25(1): 113-121.
[45] JANSEN T, BURNS F. Density dependent growth changes through juvenile and early adult life of North East Atlantic Mackerel (Scomber scombrus)[J]. Fish Res, 2015, 169: 37-44.
[46] REZNICK D N, GHALAMBOR C K. Can commercial fishing cause evolution? Answers from guppies (Poecilia reticulata)[J]. J Canadien Des Sciences Halieutiques Et Aquatiques, 2005, 62(4): 791-801.
[47] De ROOS A M, BOUKAL D S, PERSSON L. Evolutionary regime shifts in age and size at maturation of exploited fish stocks[J]. Proc Biol Sci, 2006, 273(1596): 1873-1880.
[48] FUKUWAKA M A, MORITA K. Increase in maturation size after the closure of a high seas gillnet fishery on hatchery-reared chum salmon Oncorhynchus keta[J]. Evol Appl, 2008, 1(2): 376-387.
[49] 陈作志, 林昭进, 邱永松. 基于AHP的南海海域渔业资源可持续利用评价[J]. 自然资源学报, 2010, 25(2): 249-257. [50] 陈作志, 孔啸兰, 徐姗楠, 等. 北部湾深水金线鱼种群参数的动态变化[J]. 水产学报, 2012, 36(4): 584-591. [51] NGUYEN L, NGUYEN B T. Assessment of Tonkin Gulf fishery - Vietnam based on the bio-economic models[C]//Proceedings of the Fourteenth Biennial Conference of the International Institute of Fisheries Economics & Trade, Nha Trang, Vietnam, July 22-25, 2008: Achieving a Sustainable Future: Managing Aquaculture, Fishing, Trade and Development. SHRIVER A L. Corvallis, Oregon, USA: International Institute of Fisheries Economics & Trade, 2008: 1-10.


计量
- 文章访问数: 4488
- HTML全文浏览量: 2115
- PDF下载量: 53
 粤公网安备 44010502001741号
