
-
Abstract:
The statistical experimental design (Plackett-Burman and Box-Behnken design) was applied to optimize the culture medium of nitrite oxidizing bacteria for improving the nitrite oxidizing rate. Estimated optimum medium composition of the nitrite oxidizing rate was as follows: NaHCO3 2.0 g · L-1; NaNO2 2.36 g · L-1; Na2CO3 0.37 g · L-1; NaCl 0.34 g ·L-1; KH2PO4 0.05 g · L-1; MgSO4 · 7H2O 0.05 g · L-1; and FeSO4 · 7H2O 0.03 g · L-1. The nitrite oxidizing rate reached a maximum at 905.0 mg NO2-N · (g MLSS · d)-1(mixed liquor suspended solids, MLSS).In the field trial, 50 L of nitrite oxidizing bacteria concentrate (1.99 g VSS · L-1)(volatile solid, VSS) with 850 mg NO2-N · (g MLSS · d)-1 were added to 0.6 hectares of the aquaculture water. Nitrite level in all treated ponds remained very low compared to the steady increase observed in all of the control ponds during 7 days.
摘要:为提高硝化菌的亚硝酸盐氧化能力, 利用统计试验设计(Plackett-Burman和Box-Behnken设计)优化得到一最佳培养基: NaHCO3 2.0 g · L-1; NaNO 2 2.36 g · L-1; Na2CO3 0.37 g · L-1; NaCl 0.34 g · L-1; KH2PO4 0.05 g ·L-1; MgSO4 · 7H2O 0.05 g · L-1; FeSO4 · 7H2O 0.03 g · L-1。在此条件下, 硝化菌的最大亚硝酸盐氧化速率达到905.0 mg NO2-N · (g MLSS · d)-1(mixed liquor suspended solids, MLSS, 混合液悬浮固体)。将50 L降解速率为850 mg NO2-N · (g MLSS · d)-1的硝化菌(浓度为1.99 g VSS · L-1)(volatile solid, VSS, 挥发性固体)投加至0.6 hm2的养殖水体中, 7 d内试验水体中的亚硝酸盐浓度即降至安全浓度以下。
-
关键词:
- 硝化细菌 /
- 硝化菌(NOB) /
- 优化 /
- Plackett-Burman设计 /
- 响应面法 /
- Box-Beknken设计
-
In aquaculture systems, the accumulation of high concentration of nitrite, toxic to aquatic organisms, is commonly prevented by active removal by nitrite oxidizing bacteria(NOB)[1-2].
In newly set-up aquaculture systems, nitrite can reach concentration toxic to fish and shrimp before a sufficient biomass of NOB established. To reduce the length of time for establishment of NOB, commercial preparations of these organisms are available to seed the aquarium environment[3-5].
The optimization of fermentation medium is of primary importance in the development of any fermentation processes. Conventionally, fermentation process was optimized by implementing one factor at a time[6]. Whereas at present, this approach has been replaced with statistical designs for screen of important factors and optimize of those important factors[7-8]. The use of statistical experimental design in the optimization of fermentation processes or media is well documented[9-10]. But there was no studies dealing with the optimization of nitrite oxidizing bacteria for improving the nitrite oxidizing rate.
In the present work, we reported a sequential optimization strategy for nitrite oxidizing rate by nitrite oxidizing bacteria. The objective of this paper is how to use statistical experimental designs to optimize the fermentation media for nitrite oxidizing rate in shake flask experiments, and to apply the nitrite oxidizing bacteria preparations to treat the nitrite of aquaculture.
1. Materials and Methods
1.1 Organism and culture conditions
Nitrite oxidizing bacteria (NOB 013) was isolated from aquaria, and stored in the vapor phase above liquid nitrogen. Before experiment, NOB was incubated at 28~30℃ in 500 mL seed cultures containing NaCl (0.3 g · L-1), MgSO4 · 7H2O (0.14 g · L-1), FeSO4 ·7H2O (0.03 g · L-1), KH2PO4 (0.136 g · L-1), NaNO2 (0.5 g · L-1), NaHCO3 (1.6 g · L-1).The pH was adjusted to 7.6. The medium was placed into 1 000 mL Erlenmeyer at 170 rpm for 2 days.
1.2 Analytical method
Because of the strong adhesion of NOB[11], it was very difficult to count the number of NOB. In this paper, the nitrite oxidizing rate of NOB served as response. The nitrite oxidizing rate was determined by incubating with NaNO2 as substrate at 30℃ and pH 7.5~7.8[12]. The unit is mg NO2--N · (g MLSS · d)-1 (mixed liquor suspended solids, MLSS).
1.3 Experimental type and software
1.3.1 Plackett-Burman design
Plackett-Burman design is based on the first order model:
$$ Y=\beta_0+\sum \beta_i X_i $$ (1) Where, Y is the response, β0 is the model intercept and βi is the linear coefficient, and Xi is the level of the independent variable. For screening purpose, various medium components and culture parameters were investigated. Based on the Plackett-Burman design, each factor was prepared in two levels: -1 for low level and +1 for high level. Eight assigned variables and three unassigned variables, commonly referred as the dummy, were screened in eighteen experimental designs(with three centre points). Tab. 1 illustrated the levels of each factor used in the experimental design, whereas, Tab. 2 represents the design matrix. The statistical software package Minitab (Version 15.1, Minitab Inc., Pennsylvania, USA) was used to analyze the experimental design. The purpose of three centre points was to assess the error and curvature.
Table 1. Level of the variables and statistical analysis of Plackett-Burman designcode variable low level (-1) high level (+1) effect t-values P-values X1 NaHCO3 2.0 3.0 33.33 2.29 0.070 X2 Na2CO3 0.2 0.4 150.67 10.36 0.000 X3 NaNO2 1.5 2.5 135.67 9.33 0.000 X4 Glucose 0 0.3 -56.67 -3.90 0.011 X5 FeSO4·7H2O 0.03 0.05 -7.67 -0.53 0.621 X6 NaCl 0.3 0.4 36.67 2.52 0.053 X7 KH2PO4 0.05 0.1 2.33 0.16 0.879 X8 MgSO4·7H2O 0.05 0.1 12.33 0.85 0.435 Table 2. Plackett-Burman design matrixrun X1 X2 X3 X4 X5 X6 X7 X8 nitrite oxidizing rate/mg NO2-N·(g MLSS·d)-1 1 2.5 0.3 2.0 0.15 0.04 0.35 0.075 0.075 857 2 2.0 0.2 1.5 0.00 0.03 0.30 0.050 0.050 613 3 3.0 0.2 2.5 0.00 0.03 0.30 0.100 0.100 796 4 2.0 0.2 1.5 0.30 0.05 0.40 0.050 0.100 597 5 2.5 0.3 2.0 0.15 0.04 0.35 0.075 0.075 878 6 3.0 0.4 1.5 0.30 0.05 0.30 0.100 0.050 743 7 2.0 0.4 1.5 0.00 0.03 0.40 0.100 0.100 795 8 3.0 0.4 2.5 0.00 0.05 0.40 0.050 0.100 974 9 2.0 0.4 2.5 0.30 0.03 0.40 0.100 0.050 873 10 3.0 0.2 1.5 0.00 0.05 0.40 0.100 0.050 641 11 3.0 0.4 1.5 0.30 0.03 0.30 0.050 0.100 716 12 3.0 0.2 2.5 0.30 0.03 0.40 0.050 0.050 742 13 2.5 0.3 2.0 0.15 0.04 0.35 0.075 0.075 884 14 2.0 0.4 2.5 0.00 0.05 0.30 0.050 0.050 863 15 2.0 0.2 2.5 0.30 0.05 0.30 0.100 0.100 671 16 2.5 0.3 2.0 0.15 0.04 0.35 0.075 0.075 857 17 2.0 0.2 1.5 0.00 0.03 0.30 0.050 0.050 613 18 3.0 0.2 2.5 0.00 0.03 0.30 0.100 0.100 796 Note: S=25.18;R2=98.23% 1.3.2 Box-Behnken design
In order to optimize the important factors for enhanced nitrite oxidizing rate, a three variable Box-Behnken design with three replicates at the center point was applied. For statistical calculations, the relation between the coded values and actual values are described as the following equation:
$$ X_i=\left(A_i-A_0\right) / \triangle A $$ (2) Where Xi is a coded value of the variable; Ai is the actual value of variable; A0 is the actual value of the A0 at the centre point; and △A is the step change of variable. The levels of the variables and the experimental design were shown in Tab. 3. A second-order polynomial function was fitted to correlate relationship between variable and response. The quadratic equation was following:
$$ Y=\beta_0+\sum \beta_i X_i+\sum \beta_{i i} X_i^2+\sum \beta_{i j} X_i X_j $$ (3) Table 3. The Box-Behnken design with three independent variablesrun Na2CO3/g·L-1 NaNO2/g·L-1 NaCl/g·L-1 nitrite oxidizing rate/mg
NO2-N·(gMLSS·d)-1X1 Code X1 X2 Code X2 X3 Code X3 1 0.35 0 2.25 0 0.35 0 901 2 0.35 0 2.50 +1 0.40 +1 874 3 0.30 -1 2.00 -1 0.35 0 817 4 0.35 0 2.00 -1 0.30 -1 846 5 0.35 0 2.25 0 0.35 0 895 6 0.30 -1 2.25 0 0.30 -1 842 7 0.35 0 2.00 -1 0.40 +1 803 8 0.40 +1 2.25 0 0.30 -1 883 9 0.30 -1 2.25 0 0.40 +1 831 10 0.35 0 2.50 +1 0.30 -1 854 11 0.40 +1 2.00 -1 0.35 0 863 12 0.40 +1 2.50 +1 0.35 0 894 13 0.35 0 2.25 0 0.35 0 896 14 0.30 -1 2.50 +1 0.35 0 875 15 0.40 +1 2.25 0 0.40 +1 835 Note: S=7.00;R2=98.17% Where, Y is the predicted response; β0 is a constant; βi is the linear coefficients; βii is the squared coefficients; and βij is the cross-product coefficients. The statistical software package Minitab was used to analyze the experimental design.
1.4 The field trial of NOB
A field trial was conducted at Sun Yatsen city. Three separate ponds (around 0.6 hectares each) were treated with NOB microbial product, where 50 L of concentrated NOB (1.99 g VSS · L-1) (volatile solid, VSS) with 850 mg NO2-N · (g MLSS · d)-1 were added to these ponds, when the nitrite was accumulated to 2.5, 2.0, 2.6 mg · L-1 in these ponds. Three additional identically sized and stocked ponds (nitrite: 2.1, 2.6, 3.1 mg · L-1) served as the non-treated controls, receiving the same amount of food as the treated ponds. All ponds were mechanically aerated. Water temperature and salinity in the ponds followed typical seasonal fluctuation, with an average temperature range of 27~33℃, and salinity of 23~25 mg · L-1. Ponds were fed daily, with up to four feedings per day.
2. Results and discussion
2.1 The screening stage: Plackett-Burman design (P-B design) and analysis
An initial set of 8 media components was identified as potentially affecting the nitrite oxidizing rate of NOB. These factors, along with their low and high factor levels, were provided in Tab. 1.
The screening design usually uses the factional factorial design(FFD), because the resolution of P-B design is III. Resolution=3 means that main effects are not confounded with other main effects, but they are confounded with one or more two-way interactions, which must be assumed to be zero for the main effects to be meaningful. However the resolution of FFD is IV, resolution= 4 means that main effects are not confounded with other main effects or two-factor interactions, and two-factor interactions can be confounded with other two-factor interaction.
But there were 8 media components in this work, running experiments would cost time and money, so P-B design was chosen to screening the important components from the all media components. The number of runs was 15(with 3 centre points) that reduced from 19 if FFD with 3 centre points was applied in this experiment. The results were provided in Tab. 2. The purpose of three centre points was to assess the error and curvature. The low and high factor levels were coded as -1 and +1, respectively, for the analysis of the data, the mid-level (for the centre points) were coded as 0.
The parameter estimates of the media components were given in Tab. 1. The media components having the significance(P-value < 0.05) at this stage including Na2CO3, NaNO2, Glucose, and NaCl was an important factor(P-value=0.053).But Glucose had negative and the low level was 0 g · L-1, so it was removed from the media. The effect of other factors was positive and had insignificant effect, fixed at low level and entered the following experiments because of reducing cost price. The most important thing is that the curvature term was significant(P=0.001 < 0.05), indicating the optimal conditions were likely inside the current experimental region.
2.2 Optimization stage: Box-Behnken design and analysis
Because the P-value of curvature was 0.001 < 0.05, which indicated the present region was optimal region, Box-Behnken design was applied to optimize three medium components. The design and result of Box-Behnken design were provided in Tab. 3.
The R2 was 98.17%, and the P-value of lack of fit was 0.124, that indicated the model appeared to be appropriate for the optimal region. The response surface and contours also indicated the same result(Fig. 1~3).By applying the Box-Behnken design, the following second-order polynomial equation was found to explain the nitrite oxidizing rate:
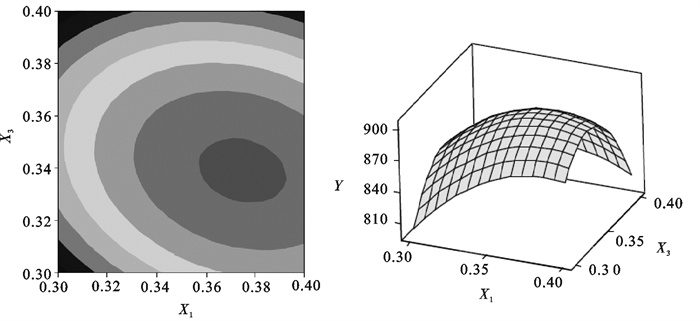
$$ \begin{aligned} & \;\;\;\;\;\;\;Y=-3\;\;194.6\;\;+\;\;7\;\;206.7 X_1\;\;+\;\;1\;\;221.0 X_2\;\;+ \\ & 7716.7 X_3-6316.7 X_1 X_1-308.7 X_2 X_2-13516.7 X_3 X_3 \\ & -540 X_{\mathrm{Y}} X_2-3700.0 X_Y X_3+1260.0 X_2 X_3 \end{aligned} $$ (4) ![]() Figure 1. The corresponding contour plot and response surface plot showing the effects of Na2CO3, NaNO2 and their mutual interaction on nitrite oxidizing rate, with 0 level of NaCl(0.35 g · L-1)
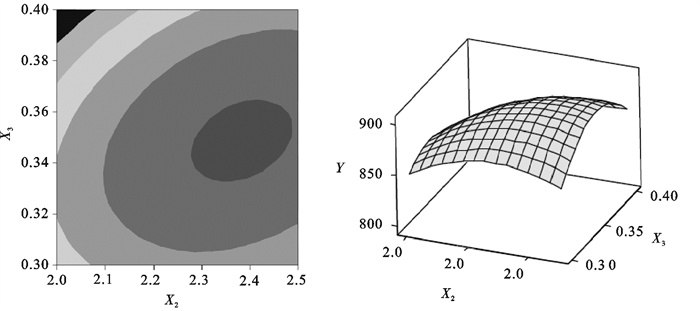
Figure 1. The corresponding contour plot and response surface plot showing the effects of Na2CO3, NaNO2 and their mutual interaction on nitrite oxidizing rate, with 0 level of NaCl(0.35 g · L-1)![]() Figure 2. The corresponding contour plot and response surface plot showing the effects of Na2CO3, NaCl and their mutual interaction on nitrite oxidizing rate, with 0 level of NaNO2(2.25 g · L-1)
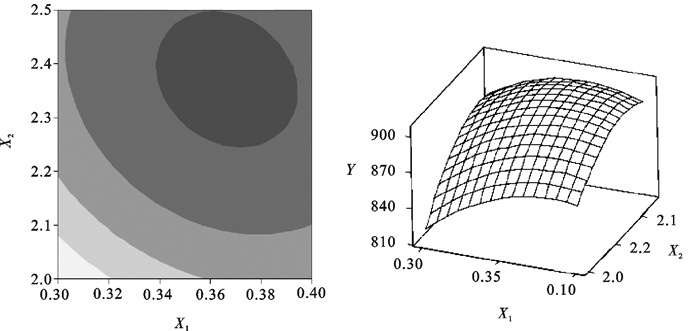
Figure 2. The corresponding contour plot and response surface plot showing the effects of Na2CO3, NaCl and their mutual interaction on nitrite oxidizing rate, with 0 level of NaNO2(2.25 g · L-1)![]() Figure 3. The corresponding contour plot and response surface plot showing the effects of NaNO2, NaCl and their mutual interaction on nitrite oxidizing rate, with 0 level of Na2CO3(0.35 g · L-1).
Figure 3. The corresponding contour plot and response surface plot showing the effects of NaNO2, NaCl and their mutual interaction on nitrite oxidizing rate, with 0 level of Na2CO3(0.35 g · L-1).Where, Y is the predicted nitrite oxidizing rate; X1, X2, and X3 are the values of Na2CO3, NaNO2 and NaCl, respectively.
The parameter estimates(Tab. 4) and analysis of variance(Tab. 5) suggest that the linear, square and interaction terms have a significant effect on nitrite oxidizing rate(P-value < 0.05).
Table 4. Parameters estimates of Box-Behnken designterm coefficient t-value P-value term coefficient t-value P-value constant -3 194.6 -5.862 0.002 X2×X2 -308.7 -5.294 0.003 X1 7 206.7 5.558 0.003 X3×X3 -13 516.7 -9.273 0.000 X2 1 221.0 4.112 0.009 X1×X2 -540.0 -1.928 0.112 X3 7 716.7 5.952 0.002 X1×X3 -3 700.0 -2.642 0.046 X1×X1 -6 316.7 -4.333 0.007 X2×X3 1 260.0 4.498 0.006 Table 5. Analysis of varianceresource DF Adj SS Adj MS F-value P-value regression 9 13 186.43 1 465.16 29.88 0.001 linear 3 2 954.63 984.88 20.09 0.003 square 3 5 788.68 1 929.56 39.35 0.001 interaction 3 1 516.75 505.58 10.31 0.014 residual error 5 245.17 49.03 lack-of-fit 3 224.50 74.83 7.24 0.124 pure error 2 20.67 10.33 total 14 From equations derived by differentiation of Eq.(4), the optimal value of X1, X2 and X3 in the uncoded units were 0.37, 2.36 and 0.34 respectively. Correspondingly, we can obtain the maximum point of the model, which was 905.0 mg NO2-N · (g MLSS ·d)-1[2.30 g NO2-N · (g MLSS ·d)-1], and this nitrite oxidizing rate exceeded the results of Grommen et al. [0.3~0.5 g NO2-N · (g MLSS · d)-1][13].
Using the software, the response surface curves and its corresponding contour curves described by the regression model were constructed in Fig. 1~3. Here, each response surface plot represented the effect of two independent variables at an optimal level of the third variable. The shape of the corresponding contour plots indicated whether the mutual interactions between the independent variables were significant or not. As shown in Fig. 1~3, the response surface of nitrite oxidizing rate showed a clear peak, indicating that the optimum condition fell inside the design boundary well.
2.3 The field trial of NOB
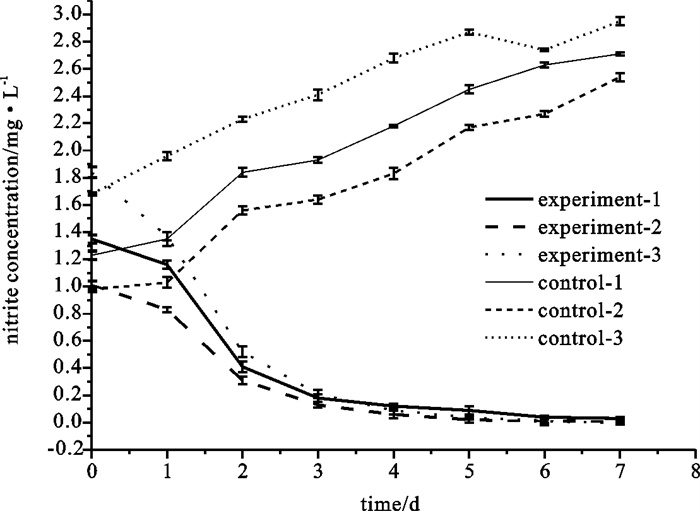
The results showed clearly that the NOB was effective at oxidizing nitrite to nitrate(Fig. 4). The nitrite concentrate was reduced to 0.1 mg · L-1 after 3 days. However, the nitrite concentrate of no-treated controls accumulated to 2.7, 3.2 and 3.8 mg · L-1 after 3 days.
![]() Figure 4. Variation of nitrite concentration in shrimp aquaculture water as a function of time (2006.7.8~2006.7.15)
Figure 4. Variation of nitrite concentration in shrimp aquaculture water as a function of time (2006.7.8~2006.7.15)3. Conclusions
(1) Estimated optimum medium composition of the nitrite oxidizing rate was as follows: NaHCO3, 2.0 g · L-1; NaNO2, 2.36 g · L-1; Na2CO3, 0.37 g ·L-1; NaCl, 0.34 g · L-1; KH2PO4, 0.05 g · L-1; MgSO4 · 7H2O, 0.05 g · L-1; and FeSO4 · 7H2O, 0.03 g ·L-1. The nitrite oxidizing rate reached a maximum at 905.0 mg NO2-N · (g MLSS · d)-1.
(2) The proper use of sequential statistical experimental design can allow the experimentalist to reduce the complexity of a problem by identifying the important effect factors and focusing future experiments on those factors.
(3) The results of the field trial showed that appropriate amount of NOB microbial product can reduce the nitrite to safe level(< 0.2 mg · L-1) quickly after 3 days.
-
![]()
Figure 1. The corresponding contour plot and response surface plot showing the effects of Na2CO3, NaNO2 and their mutual interaction on nitrite oxidizing rate, with 0 level of NaCl(0.35 g · L-1)
![]()
Figure 2. The corresponding contour plot and response surface plot showing the effects of Na2CO3, NaCl and their mutual interaction on nitrite oxidizing rate, with 0 level of NaNO2(2.25 g · L-1)
![]()
Figure 3. The corresponding contour plot and response surface plot showing the effects of NaNO2, NaCl and their mutual interaction on nitrite oxidizing rate, with 0 level of Na2CO3(0.35 g · L-1).
![]()
Figure 4. Variation of nitrite concentration in shrimp aquaculture water as a function of time (2006.7.8~2006.7.15)
Table 1 Level of the variables and statistical analysis of Plackett-Burman design
code variable low level (-1) high level (+1) effect t-values P-values X1 NaHCO3 2.0 3.0 33.33 2.29 0.070 X2 Na2CO3 0.2 0.4 150.67 10.36 0.000 X3 NaNO2 1.5 2.5 135.67 9.33 0.000 X4 Glucose 0 0.3 -56.67 -3.90 0.011 X5 FeSO4·7H2O 0.03 0.05 -7.67 -0.53 0.621 X6 NaCl 0.3 0.4 36.67 2.52 0.053 X7 KH2PO4 0.05 0.1 2.33 0.16 0.879 X8 MgSO4·7H2O 0.05 0.1 12.33 0.85 0.435  下载: 导出CSV
Table 2 Plackett-Burman design matrix
run X1 X2 X3 X4 X5 X6 X7 X8 nitrite oxidizing rate/mg NO2-N·(g MLSS·d)-1 1 2.5 0.3 2.0 0.15 0.04 0.35 0.075 0.075 857 2 2.0 0.2 1.5 0.00 0.03 0.30 0.050 0.050 613 3 3.0 0.2 2.5 0.00 0.03 0.30 0.100 0.100 796 4 2.0 0.2 1.5 0.30 0.05 0.40 0.050 0.100 597 5 2.5 0.3 2.0 0.15 0.04 0.35 0.075 0.075 878 6 3.0 0.4 1.5 0.30 0.05 0.30 0.100 0.050 743 7 2.0 0.4 1.5 0.00 0.03 0.40 0.100 0.100 795 8 3.0 0.4 2.5 0.00 0.05 0.40 0.050 0.100 974 9 2.0 0.4 2.5 0.30 0.03 0.40 0.100 0.050 873 10 3.0 0.2 1.5 0.00 0.05 0.40 0.100 0.050 641 11 3.0 0.4 1.5 0.30 0.03 0.30 0.050 0.100 716 12 3.0 0.2 2.5 0.30 0.03 0.40 0.050 0.050 742 13 2.5 0.3 2.0 0.15 0.04 0.35 0.075 0.075 884 14 2.0 0.4 2.5 0.00 0.05 0.30 0.050 0.050 863 15 2.0 0.2 2.5 0.30 0.05 0.30 0.100 0.100 671 16 2.5 0.3 2.0 0.15 0.04 0.35 0.075 0.075 857 17 2.0 0.2 1.5 0.00 0.03 0.30 0.050 0.050 613 18 3.0 0.2 2.5 0.00 0.03 0.30 0.100 0.100 796 Note: S=25.18;R2=98.23%
下载: 导出CSV
Table 3 The Box-Behnken design with three independent variables
run Na2CO3/g·L-1 NaNO2/g·L-1 NaCl/g·L-1 nitrite oxidizing rate/mg
NO2-N·(gMLSS·d)-1X1 Code X1 X2 Code X2 X3 Code X3 1 0.35 0 2.25 0 0.35 0 901 2 0.35 0 2.50 +1 0.40 +1 874 3 0.30 -1 2.00 -1 0.35 0 817 4 0.35 0 2.00 -1 0.30 -1 846 5 0.35 0 2.25 0 0.35 0 895 6 0.30 -1 2.25 0 0.30 -1 842 7 0.35 0 2.00 -1 0.40 +1 803 8 0.40 +1 2.25 0 0.30 -1 883 9 0.30 -1 2.25 0 0.40 +1 831 10 0.35 0 2.50 +1 0.30 -1 854 11 0.40 +1 2.00 -1 0.35 0 863 12 0.40 +1 2.50 +1 0.35 0 894 13 0.35 0 2.25 0 0.35 0 896 14 0.30 -1 2.50 +1 0.35 0 875 15 0.40 +1 2.25 0 0.40 +1 835 Note: S=7.00;R2=98.17%
下载: 导出CSV
Table 4 Parameters estimates of Box-Behnken design
term coefficient t-value P-value term coefficient t-value P-value constant -3 194.6 -5.862 0.002 X2×X2 -308.7 -5.294 0.003 X1 7 206.7 5.558 0.003 X3×X3 -13 516.7 -9.273 0.000 X2 1 221.0 4.112 0.009 X1×X2 -540.0 -1.928 0.112 X3 7 716.7 5.952 0.002 X1×X3 -3 700.0 -2.642 0.046 X1×X1 -6 316.7 -4.333 0.007 X2×X3 1 260.0 4.498 0.006
下载: 导出CSV
Table 5 Analysis of variance
resource DF Adj SS Adj MS F-value P-value regression 9 13 186.43 1 465.16 29.88 0.001 linear 3 2 954.63 984.88 20.09 0.003 square 3 5 788.68 1 929.56 39.35 0.001 interaction 3 1 516.75 505.58 10.31 0.014 residual error 5 245.17 49.03 lack-of-fit 3 224.50 74.83 7.24 0.124 pure error 2 20.67 10.33 total 14
下载: 导出CSV
-
[1] FRANCES J, ALLAN G L, NOWAK B F. The effects of nitrite on the shortterm growth of silver perch (Bidyanus bidyanus) [J]. Aquac, 1998, 163(1/2): 63-72. doi: 10.1016/S0044-8486(98)00219-1
[2] SHAN H, OBBARD J P. Ammonia removal from prawn aquaculture water using immobilized nitrifying bacteria[J]. Appl Microbiol Biotechnol, 2001, 57(17): 791-798. doi: 10.1007/s00253-001-0835-1
[3] 任杰, 林炜铁, 罗小春, 等. 硝化菌保藏特性及衰减动力学研究[J]. 中国生物工程杂志, 2007, 27(12): 61-65. doi: 10.3969/j.issn.1671-8135.2007.12.013 [4] 李卓佳, 郭志勋, 冯娟, 等. 应用芽孢杆菌调控虾池微生态的初步研究[J]. 海洋科学, 2006, 30(11): 28-31. doi: 10.3969/j.issn.1000-3096.2006.11.007 [5] 李卓佳, 林亮, 杨莺莺, 等. 芽孢杆菌制剂对凡纳滨对虾Litopenaeus vannamei肠道微生物群落的影响[J]. 南方水产, 2005, 1(3): 54-59. doi: 10.3969/j.issn.2095-0780.2005.03.009 [6] 林影, 张聚宝, 向柱方. 假丝酵母Candida sp. 木糖发酵生产乙醇[J]. 华南理工大学学报: 自然科学版, 2006, 34(5): 33-37. doi: 10.3321/j.issn:1000-565X.2006.05.007 [7] ANBU P, GOPINATH S C B, HILDA A, et al. Optimization of extracellular keratinase production by poultry farm isolate Scopulariopsis brevicaulis[J]. Bioresour Technol, 2006, 98(6): 1 298-1 303. doi: 10.1016/j.biortech.2006.05.047
[8] MAO Xiangzhao, SHEN Yaling, YANG Liang, et al. Optimizing the medium compositions for accumulation of the novel FR-008/Candicidin derivatives CS101 by a mutant of Streptomyces sp. using statistical experimental methods[J]. Process Biochem, 2007, 42(5): 878-883. doi: 10.1016/j.procbio.2007.01.004
[9] JOHN R P, SUKUMARAN R K, NAMPOOTHIRI M K, et al. Statistical optimization of simultaneous saccharification and L (+)lactic acid fermentation from cassava bagasse using mixed culture of lactobacilli by response surface methodology[J]. Biochem Eng J, 2007, 36(3): 262-267. doi: 10.1016/j.bej.2007.02.028
[10] ISAR J, AGARWAL L, SARAN S, et al. A statistical method for enhancing the production of succinic acid from Escherichia coli under anaerobic conditions[J]. Bioresour Technol, 2006, 97(13): 1 443-1 448. doi: 10.1016/j.biortech.2005.07.014
[11] WILEN B M, JIN B, LANT P. The influence of key chemical constituents in activated sludge on surface and flocculating properties[J]. Water Res, 2003, 37(9): 2 127-2 139. doi: 10.1016/S0043-1354(02)00629-2
[12] SALEM S, MOUSSA M S, VAN LOOSDRECHT M C. Determination of the decay rate of nitrifying bacteria[J]. Biotechnol Bioeng, 2006, 94(2): 252-262. doi: 10.1002/bit.20822
[13] GROMMEN R, VAN HAUTEGHEM I, VAN WAMBEKE, et al. An improved nitrifying enrichment to remove ammonium and nitrite from freshwater aquaria systems[J]. Aquac, 2002, 211(1/4): 115-124. doi: 10.1016/S0044-8486(01)00883-3
计量
- 文章访问数: 5811
- HTML全文浏览量: 151
- PDF下载量: 3555
 粤公网安备 44010502001741号
