
Effect of nitrate and phosphate concentration on growth of Microcystis wesenbergii and Scenedesmus obliquus
-
摘要:
以惠氏微囊藻(Microcystis wesenbergii)和斜生栅藻(Scenedesmus obliquus)为研究对象,对比研究了氮(N)或磷(P)营养盐的相对限制对种群增长的影响。结果表明,培养11 d后,氮限制对惠氏微囊藻比生长速率、生物量、叶绿素浓度的最大抑制效应分别为2.25%、2.75%和40.01%;而对斜生栅藻的抑制效应分别为38.56%、58.64%和72.51%。磷限制对惠氏微囊藻比生长速率、生物量、叶绿素浓度的最大抑制效应分别为11.79%、10.94%和51.94%;对斜生栅藻的抑制效应分别为22.69%、49.62%和26.87%。氮磷营养盐起始浓度与2种微藻比生长速率、生物量之间多呈线性或指数型正相关关系。氮或磷单一营养盐处于富营养状态时,磷或氮营养盐浓度降低,惠氏微囊藻的生长仍能够维持在较高的水平,而斜生栅藻的生长则表现出显著的抑制效应。惠氏微囊藻对氮、磷限制的低敏感性是其获得种间竞争优势的生理学基础。
Abstract:Taking Microcystis aeruginosa and Scenedesmus obliquus as samples, we investigated the effect of concentration of nitrate and phosphate on algal growth. The results show that the maximum inhibitory rates of nitrate limitation on algal growth rate, biomass and chlorophyll content of M.wesenbergii were 2.25%, 2.75% and 40.01%, respectively, while those of S.obliquus were 38.56%, 58.64% and 72.51%, respectively. The maximum inhibitory rates of phosphate limitation on algal growth rate, biomass and chlorophyll content of M.wesenbergii were 11.79%, 10.94% and 51.94%, respectively, while those of S.obliquus were 22.69%, 49.62% and 26.87%, respectively. The positive correlation was observed among nitrate, phosphorus concentrations and algal growth rate, biomass both in linear or exponential types. Growth of S.obliquus was inhibited seriously compared with that of M.wesenbergii at nitrate or phosphate limitation. Lower sensitivity to nitrate or phosphate limitation of M.wesenbergii might support the priority of algal growth and competition.
-
Keywords:
- Microcystis wesenbergii /
- Scenedesmus obliquus /
- nitrate /
- phosphate
-
鲷科鱼类(Sparidae)约有33属110种,主要分布于大西洋、印度洋和太平洋的暖热水域,许多种类为优质经济鱼类[1-2]。由于品种较多,而且许多品种外部形态接近,在野外利用形态学的标准如体型、牙齿形状和位置、鳍条或鳍棘长短或数目等对许多鲷科鱼类进行品种鉴定仍然存在较大的困难,因此,有必要在实验室进行进一步的鉴定。分子生物学技术由于具有要求样本量少、准确、快速等优点,为品种鉴定提供了新的手段。然而,目前采用分子技术对鲷科鱼类进行种类鉴定的研究仅有少量报道,如ALARCÓN和ALVAREZ[3]首先应用同工酶标记对8种鲷科鱼类进行了品种鉴定研究,但在mtDNA水平仍然缺乏科学有效的鉴定标准。
随着科技的发展,生物遗传资源保护和应用研究日益受到重视,mtDNA序列分析技术目前已经被广泛应用于许多物种的群体遗传学和生物资源的保护和管理等研究领域。应用mtDNA序列如控制区、细胞色素b(Cyt b)及16S rRNA等序列对鲷科种类的研究已经涉及到系统发育等研究领域,如ORRELL和CARPENTER[1]、HANEL和STURMBAUER[4]及刘红艳等[5]等。通过这些研究获得的鲷科鱼类的mtDNA序列数据可以从NCBI(http://www.ncbi.nlm.nih.gov)等分子生物学数据库得到。一般认为Cyt b序列较为保守,主要用于种以上水平遗传变异的分析[6]。为了了解鲷科鱼类种间及种内遗传关系为种类鉴定提供基础信息,本研究应用生物信息学的一些手段对部分已经登陆NCBI核苷酸数据库的鲷科鱼类mtDNA Cyt b序列数据进行研究,为鲷科鱼类的种类鉴定及进一步遗传育种研究工作提供参考。
1. 材料和方法
为了进行种内及种间遗传距离分析及获得尽可能多的序列信息,在NCBI分子生物学数据库中至少具有2条1 kb以上长度的Cyt b序列的种才被纳入本研究范围。最终,通过搜索NCBI核苷酸序列数据库,下载用于本研究的Cyt b序列共有鲷科鱼类10属12种的24条序列。这些序列的基本信息见表 1。
表 1 研究所采用的Cyt b序列信息Table 1 Cyt b sequences used in this study属名
genus种名
speciesNCBI序列号
accession number薄唇鲷属 Boops boops X81567、BBO319810 牙鲷属 Dentex dentex AF143197、DDE319814 重牙鲷属 Diplodus cervinus AF240723、DCE277367 兔牙鲷属 Oblada melanura AF240701、OME319813 玉颌鲷属 Lithognathus mormyrus AF240712、LMO277371 海鲷属 Pagellus bogaraveo PBO319818、PBO276880 acarne PAC319817、PAC276879 erythrinus PER319816、PER276881 真鲷属 Pagrus pagrus AF240729、PPA319815 黑海鲷属 Spondyliosoma cantharus AF240705、SCA319811 厚唇鲷属 Sarpa salpa AF240704、SSA319812 鲷属 Sparus aurata AF240735、SAU319809 注:中文种名没有提供
Note: Chinese name for each species was not provided.应用程序Clustal X[7]对所获得的Cyt b序列进行序列比对。采用程序Mega(Ver.2.1)[8]以Kimura 2-parameter模型进行系统发育及遗传距离分析,对未知数据采用成对删除法(pairwise deletion)进行处理,通过自展法(bootstrap method;重复次数500)计算自展值。采用Excel软件计算距离均值及标准偏差(SD),并以散点图表示种内种间的遗传距离分布情况。应用程序DnaSP(Ver.4.0)[9]计算序列GC含量、核苷酸多样性(Nucleotide diversity,Pi)、单倍型多样性(haplotype diversity,Hd)等其它相关数据。
2. 研究结果
2.1 序列分析
通过序列比对最终得到了1 070 bp的Cyt b共有序列。序列GC含量为0.461,其中核苷酸C含量最高,为30.3%,G最低,为15.8%,而T、A分别为29.7%、24.2%。序列中共检测到675个单态性位点,393个变异位点,2个未知位点(315,555),没有检测到插入缺失。变异位点中单一序列变异位点(singleton variable sites)有24个,简约性信息位点(parsimony informative sites)为369个。群体单倍型多样性(Hd)为0.986,而核苷酸多样性(Pi)为0.150。有关序列信息详见表 2。
表 2 研究鲷科鱼类Cyt b序列变异位点Table 2 Variable sites of Sparidae Cyt b sequences used in this study
进一步对表 2中的序列数据进行分析发现在1 070 bp序列范围内各种类都有种特征性的变异位点(即种内所有个体都具有,而其它种没有的变异位点),如S. cantharus具有的种特征性位点最多,共24个,而O. melanura只有4个。所有种类具有4到24个不等的种特征性位点,平均约为12.42个(表 3)。
表 3 Cyt b序列种特征性位点信息Table 3 Species-specific site information of Cyt b sequences种名
species位点位置
site location小计
sumB. boops 52a,372,429,624,625,685,717,774,837 9 D. dentex 21,27,102,133,147,171,180,240,267,348,429,534,574,645,666,687,705,728,876,945,1056,1062 22 D. cervinus 333,366,387,570,810,846,996 7 O. melanura 234,360,717,855 4 L. mormyrus 12,123,252,297,447,462,483,579,591,630,633,681,693,699,702,714,726,981 18 P. bogaraveo 18,543,555,572,702,864,996 7 P. acarne 42,297,738,843,846,864,969,1038 8 P. erythrinus 7,8,237,378,468,525,537,556,585,609,612,627,693,729,945,951,1035 17 P. pagrus 21,57,315,372,519,639,756,777,981,1017 10 S. cantharus 42,66,73,102,147,258,361,366,402,423,456,483,640,660,703,705,706,759,843,891,958,984,996,1047 24 S. salpa 240,264,448,612,759,873,1003 7 S. aurata 15,30,138,417,546,600,615,675,701,729,774,841,861,960,985,1065 16 注:“a”代表种特征性位点在序列中所处的位置(参考表 2中序列)
Note: “a” represents the site location in the Cyt b sequences (refer to the sequence in Tab. 2).2.2 遗传距离分析
12个鲷种间,L. mormyrus与S. cantharus之间具有最大的遗传距离[0.220±0.017(SE)],而P. bogaraveo与P. acarne间距离最小[0.105±0.010(SE)](表 4)。种间遗传距离平均值为0.180±0.0231(SD)。种内遗传距离最大的为P. pagrus [0.018±0.004(SE)],而其它各种的种内遗传距离都要小于这一数值。种内遗传距离平均值为0.007±0.006(SD)。因此,种间距离均值约为种内距离均值的26倍,种间遗传距离要远远大于种内遗传距离。图 1中各数据点的分布也反映了这一趋势。
表 4 鲷科鱼类种内种间遗传距离关系Table 4 The genetic distances among and within Sparid species种名
species1 2 3 4 5 6 7 8 9 10 11 Da 1 0.000 2 0.193a 0.000 3 0.158 0.179 0.013 4 0.165 0.187 0.117 0.007 5 0.172 0.196 0.152 0.166 0.009 6 0.178 0.196 0.152 0.158 0.168 0.000 7 0.160 0.198 0.140 0.156 0.175 0.105 0.005 8 0.208 0.175 0.198 0.205 0.200 0.202 0.216 0.000 9 0.191 0.157 0.188 0.186 0.196 0.207 0.198 0.141 0.018 10 0.174 0.216 0.161 0.195 0.220 0.187 0.175 0.219 0.197 0.011 11 0.154 0.194 0.174 0.167 0.180 0.169 0.171 0.188 0.180 0.171 0.014 12 0.172 0.217 0.167 0.166 0.182 0.191 0.170 0.202 0.210 0.207 0.182 0.007 注:表中数值1~12分别代表鲷种B. boops、D. dentex、D. cervinus、O. melanura、L. mormyrus、P. bogaraveo、P. acarne、P. erythrinus、P. pagrus、S. cantharus、S. salpa、S. aurata。‘a’显示种间遗传距离,‘Da’代表种内遗传距离,标准误(SE)没有提供
Note:Number 1~12 represent B. boops, D. dentex, D. cervinus, O. melanura, L. mormyrus, P. bogaraveo, P. acarne, P. erythrinus, P. pagrus, S. cantharus, S. salpa, S. aurata, respectively. ‘a’indicated the genetic distance among species, whereas ‘Da’indicated the genetic distance within species; Standard Error (SE) wasn′t provided.![]() 图 1 鲷科鱼类Cyt b序列遗传距离分析Fig. 1 The genetic distances among the Cyt b sequences of the Sparidae
图 1 鲷科鱼类Cyt b序列遗传距离分析Fig. 1 The genetic distances among the Cyt b sequences of the Sparidae进一步通过序列数据集构建了所有序列的NJ系统发育树(文中系统树没有提供)。尽管有些种间的自展值相对较低(最低为20),如L. mormyrus与D. cervinus、O. melanura、P. bogaraveo及P. acar-ne,然而分析发现,同一种内的2条序列都被聚为一个类群,而且大多数都具有非常高的自展值(100)。因此,系统发育分析显示不同鲷科种能够通过Cyt b序列进行较好的区分。
3. 讨论
本研究通过对鲷科10属12个种的1 070 bp Cyt b序列进行分析,发现各鲷科种类在分析的序列范围内各种群都存在12个左右种群特征性的变异位点。刘红艳等[5]曾经报道鲷科同一种内不同个体的Cyt b基因序列具有一定的保守性。本研究也显示部分鲷科种内遗传距离为零,如B. boops、D. dentex、P. bogaraveo、P. erythrinus,而且12个鲷种种内遗传距离均值相对较低。因此,推测Cyt b基因种内保守性为鲷科种群的基本特征,在实际应用中可以应用这些保守的种特征性位点进行鲷科鱼类品种的鉴定。
比较分析显示,不同鲷科鱼类种间与种内的遗传距离差异较大,种间遗传距离[0.105±0.010(SE)~0.220±0.017(SE)]要远远大于种内遗传距离[0~0.018±0.004(SE)]。另外,系统发育分析显示,来源于同一种的2条序列都被清晰的聚为同一类群,而来源于不同种的序列分别处于不同的类群。因此,不同鲷种能够通过Cyt b序列进行较好的区分。基于以上鲷科鱼类种间与种内遗传距离数据,提出以下假设,当2个鲷科鱼类个体通过以上Cyt b序列计算得到的遗传距离如小于0.018时,可以初步判断来源于同一种,如大于0.105,则为不同种,如处于2个数据之间,则有待于进一步结合其它的数据如形态学特征、种特征性位点等进行分析以确定种群,保证鉴定的准确性。
ALARCÓN和ALVAREZ[3]首先应用同工酶标记对8种鲷科鱼类进行了品种鉴定研究。由于同工酶标记技术相对于mtDNA序列分析而言,具有制样更严格,且受个体发育时期限制等缺点,因此,本研究结果相对于前人的研究而言具有更大的实际应用价值。然而,值得注意的是,尽管以上研究对于鲷科鱼类新种的鉴定、个体或者小组织样本的品种鉴定和杂交育种的选育具有重要意义,但是,由于本研究所采用的同一种内的Cyt b序列数目相对较少,而且相对于整个鲷科鱼类而言,包含的品种数目也较少,因此,采用以上方法对鲷科鱼类中最近形成的种进行鉴定时可能由于其序列变异相对较少,从而可能出现错误的品种鉴定。另外,由于mtDNA是母性遗传的,鱼类杂种也可能被不正确的鉴定。因此,利用以上标准对鲷科鱼类进行品种鉴定时仍然要谨慎,最好与其它标准同时使用。为了准确地对鲷科鱼类进行分子鉴定,建立一个所有鲷科鱼类的Cyt b序列数据库非常必要。
-
![]()
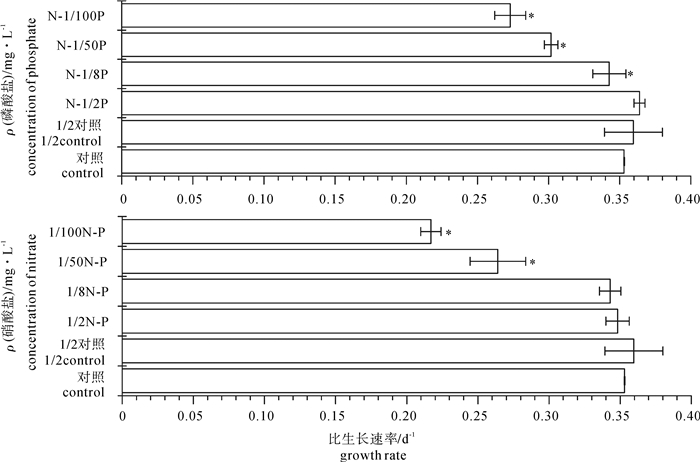
图 1 不同氮磷起始浓度下惠氏微囊藻的比生长速率
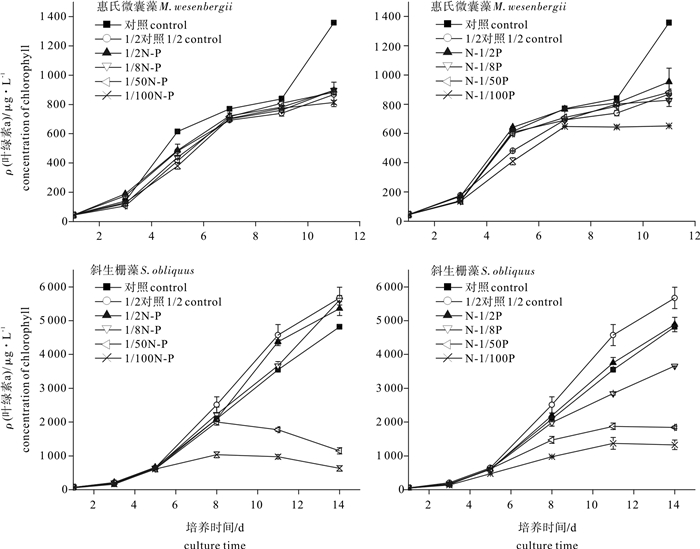
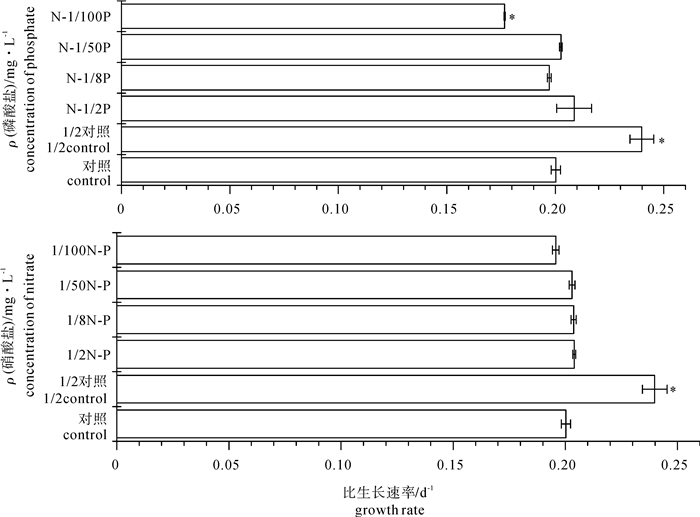
对照组为正常BG-11培养基;N.硝酸盐;P.磷酸盐;后图同此。
Figure 1. Effect of nitrogen/phosphorus concentration on growth rate of M.wesenbergii
The control treatment used BG-11 medium; N. nitrate; P. phosphate; the same case in the following figures.
![]()
图 2 不同氮磷起始浓度下斜生栅藻的比生长速率
Figure 2. Effect of nitrogen/phosphorus concentration on growth rate of S.obliquus
![]()
图 3 不同氮磷起始下微藻的叶绿素a质量浓度
Figure 3. Effect of nitrogen/phosphorus concentration on concentration of chlorophyll a
表 1 氮磷浓度对微藻生长影响实验的浓度设置
Table 1 Concentration of nitrogen and phosphorus
组别group 磷浓度/μmol·L-1
Cp (N/P)氮磷比-磷(rP) 组别group 氮浓度/μmol·L-1 CN (N/P) 氮磷比-氮(rN) 对照control 17.6/0.29 60.69 对照control 17.6/0.29 60.69 1/2对照1/2 control 8.8/0.145 60.69 1/2对照1/2 control 8.8/0.145 60.69 N-1/2P 17.6/0.145 121.38 1/2N-P 8.8/0.29 30.34 N-1/8P 17.6/0.036 485.52 1/8N-P 2.2/0.29 7.59 N-1/50P 17.6/0.005 8 3 034.5 1/50N-P 0.352/0.29 1.21 N-1/100P 17.6/0.002 9 6 069 1/100N-P 0.176/0.29 0.61  下载: 导出CSV
表 2 不同氮磷起始浓度下微藻的生物量
Table 2 Effect of nitrogen/phosphorus concentration on biomass of algae
mg·L-1 组别group 惠氏微囊藻(M.wesenbergii) 斜生栅藻(S.obliquus) 对照control 161±5.9 472±6.2 1/2对照1/2 control 201±6.8* 531±9.5* N-1/2P 168±7.7 494±17.5 N-1/8P 158±10.7 422±23.4* N-1/50P 162±1.7 292±10.3** N-1/100P 143±3.1* 238±18.6** 1/2N-P 163±4.5 538±31.9* 1/8N-P 164±1.1 507±31.1 1/50N-P 162±1.0 261±24.3** 1/100N-P 157±1.1 195±6.4** 注:对照组为正常BG-11培养基;数字代表实验组氮或磷浓度与对照组浓度的比值;N.硝酸盐;P.磷酸盐;*.显著性相关(P<0.05);**.极显著性相关(P<0.01)
Note:The control treatment used BG-11 medium;the numbers represent the ratio of N or P concentration in different treatments compared with that of control;N. nitrate;P. phosphate;*. significant difference at 0.05 level (P<0.05);**. very significant difference at 0.01 level (P<0.01)
下载: 导出CSV
表 3 氮磷浓度、氮磷比与惠氏微囊藻微藻比生长速率和生物量的相关关系拟合曲线
Table 3 Relationship between initial nitrogen, phosphorus concentration and growth rate, biomass of M.wesenbergii
方程equation 指标index 关系式relations 线性方程linear 氮磷比-磷rp 比生长速率μ=-5.22×10⁻⁶rP+0.21,R2=0.744 8,P=0.038 指数方程exponential 磷浓度Cp 干质量DW=-2 239.48×e(-Cp/0.000 59)+160.46,R2=0.967 4,P<0.01 线性方程linear 氮磷比-磷rp 干质量DW=-0.003 2r+163.21,R2=0.824 6,P=0.021 指数方程exponential 氮浓度CN 干质量DW=-76.07×e(-CN/0.07)+163.17,R2=0.721 5,P<0.01 指数方程exponential 氮磷比-氮rN 干质量DW=-79.31×e(-rN/0.24)+163.21,R2=-0.761 2, P<0.01 注:CN和CP表示实验设计的氮或磷浓度;rN和rP表示实验设计的氮或磷浓度变化产生的氮磷比检验;后表同此。
Note:CN and CP represent concentrations of nitrate and phosphate,respectively;rN and rP represent the N/P ratio varied with nitrate and phosphate,respectively;the same case in the following table.
下载: 导出CSV
表 4 氮磷浓度、氮磷比与斜生栅藻比生长速率和生物量的相关关系拟合曲线
Table 4 Relationship between initial nitrogen, phosphorus concentration and growth rate, biomass of S.obliquus
方程equation 指标index 关系式relations 指数方程exponential 磷浓度Cp 比生长速率μ=-0.12×e(-CP/0.006 7)+0.35,R2=0.902 3,P=1 线性方程linear 氮磷比-磷rp 比生长速率μ=-1.55×10⁻⁵rP+0.35,R2=0.908 9,P<0.01 指数方程exponential 磷浓度Cp 干质量DW=-291×e(-CP/0.012 3)+472,R2=0.990 6,P<0.01 线性方程linear 氮磷比-磷rp 干质量DW=-0.049rP+474.94,R2=0.931 6,P<0.01 指数方程exponential 氮浓度CN 比生长速率μ=-0.17×e(-CN/0.692)+0.35,R2=0.994 1,P=1 指数方程exponential 氮磷比-氮rN 比生长速率μ=-0.17×e(-rN/2.382)+0.35,R2=0.940 0,P=1 指数方程exponential 氮浓度CN 干质量DW=-385.77×e(-CN/0.532)+472.00,R2=0.995 7,P<0.01 指数方程exponential 氮磷比-氮rN 干质量DW=-387.37×e(-rN/1.820)+472.00,R2=-0.996 1,P<0.01
下载: 导出CSV
-
[1] O′NEIL J M, DAVIS T W, BURFORD M A, et al.The rise of harmful cyanobacteria blooms:the potential roles of eutrophication and climate change[J].Harmful Algae, 2012, 14(SI):313-334. https://www.sciencedirect.com/science/article/pii/S1568988311001557
[2] DAVIDSON K, GOWEN R J, TETT P, et al.Harmful algal blooms:how strong is the evidence that nutrient ratios and forms influence their occurrence?[J].Est Coast Shelf Sci, 2012, 115(SI):399-413. https://www.sciencedirect.com/science/article/pii/S0272771412003782
[3] LU S H, HODGKISS I J.Harmful algal bloom causative collected from Hong Kong waters[J].Hydrobiologia, 2004, 512(1/2/3):231-238. doi: 10.1007/978-94-007-0944-7_30.pdf
[4] 徐宁, 吕颂辉, 段舜山, 等.营养物质输入对赤潮发生的影响[J].海洋环境科学, 2004, 23(2):20-24. doi: 10.3969/j.issn.1007-6336.2004.02.006 [5] 周名江, 朱明远, 张经.中国赤潮的发生趋势和研究进展[J].生命科学, 2001, 13(2):54-59, 53. http://www.doc88.com/p-21797645270.html [6] HEISLER J, GLIBERT P M, BURKHOLDER J M, et al.Eutrophication and harmful algal blooms:a scientific consensus[J].Harmful Algae, 2008, 8(1):3-13. doi: 10.1016/j.hal.2008.08.006
[7] ANDERSON D M, GLIBERT P M, BURKHOLDER J M.Harmful algal blooms and eutrophication:nutrient sources, composition, and consequences[J].Est Coast, 2002, 25(4):704-726. doi: 10.1007/BF02804901
[8] XIE L, XIE P, LI S, et al.The low TN:TP ratio, a cause or a result of Microcystis blooms?[J].Water Res, 2003, 37(9):2073-2080. doi: 10.1016/S0043-1354(02)00532-8
[9] KUNIYOSHI T M, SEVILLA E, BES M T, et al.Phosphate deficiency (N/P 40:1) induces mcyD transcription and microcystin synthesis in Microcystis aeruginosa PCC7806[J].Plant Physiol Biochem, 2013, 65:120-124. doi: 10.1016/j.plaphy.2013.01.011
[10] AMANO Y, SAKAI Y, SEKIYA T, et al.Effect of phosphorus fluctuation caused by river water dilution in eutrophic lake on competition between blue-green alga Microcystis aeruginosa and diatom Cyclotella sp.[J].J Environ Sci, 2010, 22(11):1666-1673. doi: 10.1016/S1001-0742(09)60304-1
[11] 陈建中, 刘志礼, 李晓明, 等.温度、pH和氮、磷含量对铜绿微囊藻(Microcystis aeruginosa)生长的影响[J].海洋与湖沼, 2010, 41(5):714-718. doi: 10.11693/hyhz201005008008 [12] LI J, GLIBERT P M, ALEXANDER J A, et al.Growth and competition of several harmful dinoflagellates under different nutrient and light conditions[J].Harmful Algae, 2012, 13:112-125. doi: 10.1016/j.hal.2011.10.005
[13] 许海, 朱广伟, 秦伯强, 等.氮磷比对水华蓝藻优势形成的影响[J].中国环境科学, 2011, 31(10):1676-1683. http://manu36.magtech.com.cn/Jweb_zghjkx/CN/abstract/abstract... [14] 代瑞华, 刘会娟, 曲久辉, 等.氮磷限制对铜绿微囊藻生长和产毒的影响[J].环境科学学报, 2008, 28(9):1739-1744. http://www.oalib.com/paper/4345022 [15] DYHRMAN S T, CHAPPELL P D, HALEY S T, et al.Phosp-honate utilization by the globally important marine diazotroph Triehodesmium[J].Nature, 2006, 439:25-26. doi: 10.1038/439025a
[16] GLIBERT P M, BURKHOLDER J M, KANA T M.Recent insights about relationships between nutrient availability, forms, and stoichiometry, and the distribution, ecophysiology, and food web effects of pelagic and benthic Prorocentrum species[J].Harmful Algae, 2012, 14(SI):231-259.
[17] HORST G P, SARNELLE O, WHITE J D, et al.Nitrogen availability increases the toxin quota of a harmful cyanobacterium, Microcystis aeruginosa[J].Water Res, 2014, 54:188-198. doi: 10.1016/j.watres.2014.01.063
[18] 丰茂武, 吴云海, 冯仕训, 等.不同氮磷比对藻类生长的影响[J].生态环境, 2008, 17(5):1759-1763. http://www.cnki.com.cn/Article/CJFDTOTAL-TRYJ200805010.htm [19] 万蕾, 朱伟, 赵联芳.氮磷对微囊藻和栅藻生长及竞争的影响[J].环境科学, 2007, 28(6):1230-1235. http://industry.wanfangdata.com.cn/yj/Detail/Periodical?id=... [20] 刘莲, 周小玉, 赵良杰, 等.氮磷比率对两种蓝藻和两种绿藻生长的影响[J].上海海洋大学学报, 2014, 23(4):573-581. http://www.cnki.com.cn/Article/CJFDTOTAL-SSDB201404014.htm [21] SUN K F, LIU W J, LIU L L, et al.Ecological risks assessment of organophosphorus pesticides on bloom of Microcystis wesenbergii[J].Int Biodeter Biodegr, 2013, 77:98-105. doi: 10.1016/j.ibiod.2012.11.010
[22] 郑朔方, 杨苏文, 金相灿.铜绿微囊藻生长的营养动力学[J].环境科学, 2005, 26(2):152-156. doi: 10.3321/j.issn:0250-3301.2005.02.031 [23] LEE J, PARKER A E, WILKERSON F P.Uptake and inhibition kinetics of nitrogen in Microcystis aeruginosa:results from cultures and field assemblages collected in the San Francisco Bay Delta, CA[J].Harmful Algae, 2015, 47:126-140. doi: 10.1016/j.hal.2015.06.002
[24] KANEKO T, NAKAJIMA N, OKAMOTO S, et al.Complete genomic structure of the bloom-forming toxic cyanobacterium Microcystis aeruginosa NIES-843[J].DNA Res, 2007, 14(6):247-256. doi: 10.1093/dnares/dsm026
[25] FRANGEUL L, QUILLARDET P, CASTETS A M, et al.Highly plastic genome of Microcystis aeruginosa PCC 7806, a ubiquitous toxic freshwater cyanobacterium[J].BMC Genomics, 2008, 9:274-293. doi: 10.1186/1471-2164-9-274
[26] SMITH V H.Low nitrogen to phosphorus ratios favor dominance by blue-green algae in lake phytoplankton[J].Science, 1983, 221(4611):669-671. doi: 10.1126/science.221.4611.669
[27] SCHINDLER D W.Evolution of phosphorus limitation in lakes[J].Science, 1977, 195:260-262. doi: 10.1126/science.195.4275.260


计量
- 文章访问数: 3452
- HTML全文浏览量: 997
- PDF下载量: 763
 粤公网安备 44010502001741号
