
Distribution, sources and ecological risk assessment of polycyclic aromatic hydrocarbons (PAHs) in coastal waters in oyster pond
-
摘要:
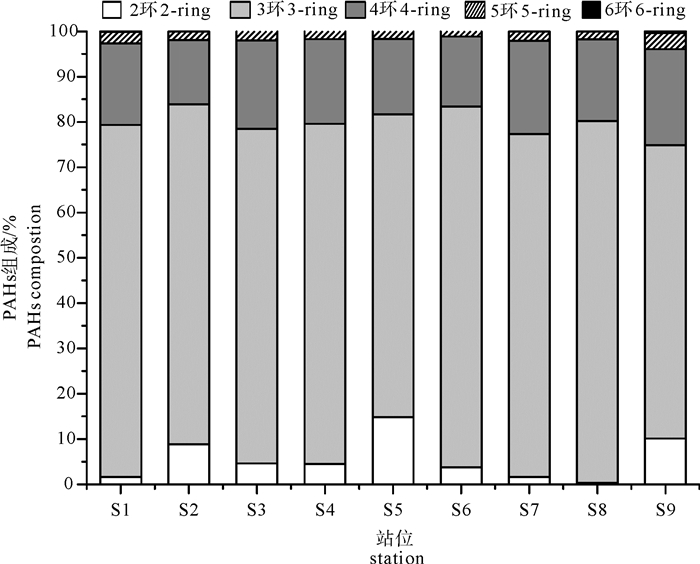
研究了长沙湾牡蛎塭池环境中多环芳烃的含量分布及其对养殖牡蛎质量安全的潜在风险。结果显示,牡蛎塭池水体、悬浮物、养殖牡蛎和沉积物中多环芳烃质量浓度分别为6.62~21.2 ng·L-1(均值9.87 ng·L-1)、92.9~355 μg·kg-1(均值198 μg·kg-1)、12.7~17.4 μg·kg-1(均值15.5 μg·kg-1)和247~615 μg·kg-1(均值322 μg·kg-1)。塭养区悬浮物平均含量高于塭养区外,但是差异不显著。塭养区水中多环芳烃平均含量与塭养区外相近,悬浮物中多环芳烃含量高于塭养区外,而沉积物中多环芳烃含量均值低于塭养区外。表层沉积物多环芳烃组成以3环为主,其次是4环。来源解析表明该区域多环芳烃主要源自化石燃料的燃烧,受养殖区周边燃煤发电工业的影响。风险评价结果显示,塭养区表层沉积物中多环芳烃含量低于效应区间低值,对养殖牡蛎安全潜在风险小,但是芴和蒽等同系物的含量介于效应区间低值和中值之间,可能会对塭养牡蛎养殖安全产生负面影响。
Abstract:We explored the distribution of PAHs in pond waters in the Changsha Bay and assessed their ecological risk to the cultured oyster. It is indicated that the range of the 16 USEPA priority PAHs in water, suspended solids, oysters and surficial sediment from the oyster ponds were 6.62~21.2 ng·L-1 (average:9.87 ng·L-1), 92.9~355 μg·kg-1(average:198μg·kg-1), 12.7~17.4 μg·kg-1(average:15.5 μg·kg-1)and 247~615 μg·kg-1(average:322 μg·kg-1), respectively. Compositional analysis of the PAHs reveals that 3-ring PAHs were dominated in the sediments, followed by 4-ring compounds. The isomeric ratios of the PAHs in sediment show that the source of the PAHs in the oyster ponds were originated predominantly from high temperature pyrolytic inputs, which may be related with the thermal power plants around the culture zone. The Effects Range Low (ERL) and Effects Range Median (ERM) were applied to assess the ecological risk. It is indicated that the PAHs in the sediment were lower than the ERL values, which was rarely associated with adverse effects on oysters cultured in the ponds. However, attention must be paid to the compounds such as fluorine and anthracene due to their contents between ERL and ERM, which will cause adverse effects on the oyster.
-
Keywords:
- marine pond culture /
- PAHs /
- oyster /
- ecological risk /
- sediment
-
鲷科鱼类(Sparidae)约有33属110种,主要分布于大西洋、印度洋和太平洋的暖热水域,许多种类为优质经济鱼类[1-2]。由于品种较多,而且许多品种外部形态接近,在野外利用形态学的标准如体型、牙齿形状和位置、鳍条或鳍棘长短或数目等对许多鲷科鱼类进行品种鉴定仍然存在较大的困难,因此,有必要在实验室进行进一步的鉴定。分子生物学技术由于具有要求样本量少、准确、快速等优点,为品种鉴定提供了新的手段。然而,目前采用分子技术对鲷科鱼类进行种类鉴定的研究仅有少量报道,如ALARCÓN和ALVAREZ[3]首先应用同工酶标记对8种鲷科鱼类进行了品种鉴定研究,但在mtDNA水平仍然缺乏科学有效的鉴定标准。
随着科技的发展,生物遗传资源保护和应用研究日益受到重视,mtDNA序列分析技术目前已经被广泛应用于许多物种的群体遗传学和生物资源的保护和管理等研究领域。应用mtDNA序列如控制区、细胞色素b(Cyt b)及16S rRNA等序列对鲷科种类的研究已经涉及到系统发育等研究领域,如ORRELL和CARPENTER[1]、HANEL和STURMBAUER[4]及刘红艳等[5]等。通过这些研究获得的鲷科鱼类的mtDNA序列数据可以从NCBI(http://www.ncbi.nlm.nih.gov)等分子生物学数据库得到。一般认为Cyt b序列较为保守,主要用于种以上水平遗传变异的分析[6]。为了了解鲷科鱼类种间及种内遗传关系为种类鉴定提供基础信息,本研究应用生物信息学的一些手段对部分已经登陆NCBI核苷酸数据库的鲷科鱼类mtDNA Cyt b序列数据进行研究,为鲷科鱼类的种类鉴定及进一步遗传育种研究工作提供参考。
1. 材料和方法
为了进行种内及种间遗传距离分析及获得尽可能多的序列信息,在NCBI分子生物学数据库中至少具有2条1 kb以上长度的Cyt b序列的种才被纳入本研究范围。最终,通过搜索NCBI核苷酸序列数据库,下载用于本研究的Cyt b序列共有鲷科鱼类10属12种的24条序列。这些序列的基本信息见表 1。
表 1 研究所采用的Cyt b序列信息Table 1 Cyt b sequences used in this study属名
genus种名
speciesNCBI序列号
accession number薄唇鲷属 Boops boops X81567、BBO319810 牙鲷属 Dentex dentex AF143197、DDE319814 重牙鲷属 Diplodus cervinus AF240723、DCE277367 兔牙鲷属 Oblada melanura AF240701、OME319813 玉颌鲷属 Lithognathus mormyrus AF240712、LMO277371 海鲷属 Pagellus bogaraveo PBO319818、PBO276880 acarne PAC319817、PAC276879 erythrinus PER319816、PER276881 真鲷属 Pagrus pagrus AF240729、PPA319815 黑海鲷属 Spondyliosoma cantharus AF240705、SCA319811 厚唇鲷属 Sarpa salpa AF240704、SSA319812 鲷属 Sparus aurata AF240735、SAU319809 注:中文种名没有提供
Note: Chinese name for each species was not provided.应用程序Clustal X[7]对所获得的Cyt b序列进行序列比对。采用程序Mega(Ver.2.1)[8]以Kimura 2-parameter模型进行系统发育及遗传距离分析,对未知数据采用成对删除法(pairwise deletion)进行处理,通过自展法(bootstrap method;重复次数500)计算自展值。采用Excel软件计算距离均值及标准偏差(SD),并以散点图表示种内种间的遗传距离分布情况。应用程序DnaSP(Ver.4.0)[9]计算序列GC含量、核苷酸多样性(Nucleotide diversity,Pi)、单倍型多样性(haplotype diversity,Hd)等其它相关数据。
2. 研究结果
2.1 序列分析
通过序列比对最终得到了1 070 bp的Cyt b共有序列。序列GC含量为0.461,其中核苷酸C含量最高,为30.3%,G最低,为15.8%,而T、A分别为29.7%、24.2%。序列中共检测到675个单态性位点,393个变异位点,2个未知位点(315,555),没有检测到插入缺失。变异位点中单一序列变异位点(singleton variable sites)有24个,简约性信息位点(parsimony informative sites)为369个。群体单倍型多样性(Hd)为0.986,而核苷酸多样性(Pi)为0.150。有关序列信息详见表 2。
表 2 研究鲷科鱼类Cyt b序列变异位点Table 2 Variable sites of Sparidae Cyt b sequences used in this study
进一步对表 2中的序列数据进行分析发现在1 070 bp序列范围内各种类都有种特征性的变异位点(即种内所有个体都具有,而其它种没有的变异位点),如S. cantharus具有的种特征性位点最多,共24个,而O. melanura只有4个。所有种类具有4到24个不等的种特征性位点,平均约为12.42个(表 3)。
表 3 Cyt b序列种特征性位点信息Table 3 Species-specific site information of Cyt b sequences种名
species位点位置
site location小计
sumB. boops 52a,372,429,624,625,685,717,774,837 9 D. dentex 21,27,102,133,147,171,180,240,267,348,429,534,574,645,666,687,705,728,876,945,1056,1062 22 D. cervinus 333,366,387,570,810,846,996 7 O. melanura 234,360,717,855 4 L. mormyrus 12,123,252,297,447,462,483,579,591,630,633,681,693,699,702,714,726,981 18 P. bogaraveo 18,543,555,572,702,864,996 7 P. acarne 42,297,738,843,846,864,969,1038 8 P. erythrinus 7,8,237,378,468,525,537,556,585,609,612,627,693,729,945,951,1035 17 P. pagrus 21,57,315,372,519,639,756,777,981,1017 10 S. cantharus 42,66,73,102,147,258,361,366,402,423,456,483,640,660,703,705,706,759,843,891,958,984,996,1047 24 S. salpa 240,264,448,612,759,873,1003 7 S. aurata 15,30,138,417,546,600,615,675,701,729,774,841,861,960,985,1065 16 注:“a”代表种特征性位点在序列中所处的位置(参考表 2中序列)
Note: “a” represents the site location in the Cyt b sequences (refer to the sequence in Tab. 2).2.2 遗传距离分析
12个鲷种间,L. mormyrus与S. cantharus之间具有最大的遗传距离[0.220±0.017(SE)],而P. bogaraveo与P. acarne间距离最小[0.105±0.010(SE)](表 4)。种间遗传距离平均值为0.180±0.0231(SD)。种内遗传距离最大的为P. pagrus [0.018±0.004(SE)],而其它各种的种内遗传距离都要小于这一数值。种内遗传距离平均值为0.007±0.006(SD)。因此,种间距离均值约为种内距离均值的26倍,种间遗传距离要远远大于种内遗传距离。图 1中各数据点的分布也反映了这一趋势。
表 4 鲷科鱼类种内种间遗传距离关系Table 4 The genetic distances among and within Sparid species种名
species1 2 3 4 5 6 7 8 9 10 11 Da 1 0.000 2 0.193a 0.000 3 0.158 0.179 0.013 4 0.165 0.187 0.117 0.007 5 0.172 0.196 0.152 0.166 0.009 6 0.178 0.196 0.152 0.158 0.168 0.000 7 0.160 0.198 0.140 0.156 0.175 0.105 0.005 8 0.208 0.175 0.198 0.205 0.200 0.202 0.216 0.000 9 0.191 0.157 0.188 0.186 0.196 0.207 0.198 0.141 0.018 10 0.174 0.216 0.161 0.195 0.220 0.187 0.175 0.219 0.197 0.011 11 0.154 0.194 0.174 0.167 0.180 0.169 0.171 0.188 0.180 0.171 0.014 12 0.172 0.217 0.167 0.166 0.182 0.191 0.170 0.202 0.210 0.207 0.182 0.007 注:表中数值1~12分别代表鲷种B. boops、D. dentex、D. cervinus、O. melanura、L. mormyrus、P. bogaraveo、P. acarne、P. erythrinus、P. pagrus、S. cantharus、S. salpa、S. aurata。‘a’显示种间遗传距离,‘Da’代表种内遗传距离,标准误(SE)没有提供
Note:Number 1~12 represent B. boops, D. dentex, D. cervinus, O. melanura, L. mormyrus, P. bogaraveo, P. acarne, P. erythrinus, P. pagrus, S. cantharus, S. salpa, S. aurata, respectively. ‘a’indicated the genetic distance among species, whereas ‘Da’indicated the genetic distance within species; Standard Error (SE) wasn′t provided.![]() 图 1 鲷科鱼类Cyt b序列遗传距离分析Fig. 1 The genetic distances among the Cyt b sequences of the Sparidae
图 1 鲷科鱼类Cyt b序列遗传距离分析Fig. 1 The genetic distances among the Cyt b sequences of the Sparidae进一步通过序列数据集构建了所有序列的NJ系统发育树(文中系统树没有提供)。尽管有些种间的自展值相对较低(最低为20),如L. mormyrus与D. cervinus、O. melanura、P. bogaraveo及P. acar-ne,然而分析发现,同一种内的2条序列都被聚为一个类群,而且大多数都具有非常高的自展值(100)。因此,系统发育分析显示不同鲷科种能够通过Cyt b序列进行较好的区分。
3. 讨论
本研究通过对鲷科10属12个种的1 070 bp Cyt b序列进行分析,发现各鲷科种类在分析的序列范围内各种群都存在12个左右种群特征性的变异位点。刘红艳等[5]曾经报道鲷科同一种内不同个体的Cyt b基因序列具有一定的保守性。本研究也显示部分鲷科种内遗传距离为零,如B. boops、D. dentex、P. bogaraveo、P. erythrinus,而且12个鲷种种内遗传距离均值相对较低。因此,推测Cyt b基因种内保守性为鲷科种群的基本特征,在实际应用中可以应用这些保守的种特征性位点进行鲷科鱼类品种的鉴定。
比较分析显示,不同鲷科鱼类种间与种内的遗传距离差异较大,种间遗传距离[0.105±0.010(SE)~0.220±0.017(SE)]要远远大于种内遗传距离[0~0.018±0.004(SE)]。另外,系统发育分析显示,来源于同一种的2条序列都被清晰的聚为同一类群,而来源于不同种的序列分别处于不同的类群。因此,不同鲷种能够通过Cyt b序列进行较好的区分。基于以上鲷科鱼类种间与种内遗传距离数据,提出以下假设,当2个鲷科鱼类个体通过以上Cyt b序列计算得到的遗传距离如小于0.018时,可以初步判断来源于同一种,如大于0.105,则为不同种,如处于2个数据之间,则有待于进一步结合其它的数据如形态学特征、种特征性位点等进行分析以确定种群,保证鉴定的准确性。
ALARCÓN和ALVAREZ[3]首先应用同工酶标记对8种鲷科鱼类进行了品种鉴定研究。由于同工酶标记技术相对于mtDNA序列分析而言,具有制样更严格,且受个体发育时期限制等缺点,因此,本研究结果相对于前人的研究而言具有更大的实际应用价值。然而,值得注意的是,尽管以上研究对于鲷科鱼类新种的鉴定、个体或者小组织样本的品种鉴定和杂交育种的选育具有重要意义,但是,由于本研究所采用的同一种内的Cyt b序列数目相对较少,而且相对于整个鲷科鱼类而言,包含的品种数目也较少,因此,采用以上方法对鲷科鱼类中最近形成的种进行鉴定时可能由于其序列变异相对较少,从而可能出现错误的品种鉴定。另外,由于mtDNA是母性遗传的,鱼类杂种也可能被不正确的鉴定。因此,利用以上标准对鲷科鱼类进行品种鉴定时仍然要谨慎,最好与其它标准同时使用。为了准确地对鲷科鱼类进行分子鉴定,建立一个所有鲷科鱼类的Cyt b序列数据库非常必要。
-
![]()
图 2 牡蛎塭池区各站位表层沉积物中多环芳烃的组成
Figure 2. Composition of PAHs in surficial sediments from sampling sites in oyster ponds
![]()
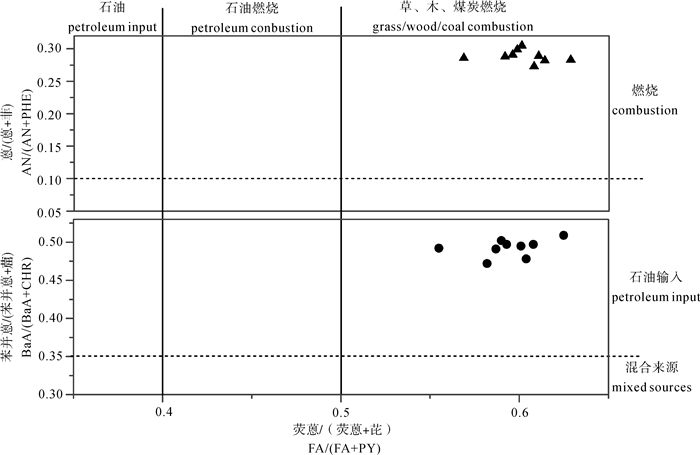
图 3 塭池表层沉积物中蒽/(蒽+菲),苯并蒽/(苯并蒽+)和荧蒽/(荧蒽+芘)异构体比值
Figure 3. Plot of AN/(AN+PHE), BaA/(BaA+CHR) and FA/(FA+PY) isomeric ratios
表 1 样品中悬浮物和多环芳烃含量
Table 1 Content of suspended solids and PAHs in environmental samples
站位
sampling siteρ(悬浮物)/mg·L-1
content of suspended solids多环芳烃含量content of PAHs 水中/ng·L-1
in water悬浮物中/μg·kg-1
in suspended solids沉积物中/μg·kg-1
in sediment牡蛎中/μg·kg-1
in oyster塭养区oyster pond S1 32.0 21.20 98.2 615 12.7 S2 29.0 6.62 214.0 305 17.3 S3 44.7 7.16 164.0 234 17.3 S4 202.0 6.38 355.0 236 15.6 S5 117.0 9.38 263.0 294 17.4 S6 88.0 8.55 92.9 247 12.7 均值 85.6 9.87 198.0 322 15.5 塭养区外outside oyster pond S7 45.0 8.59 130.0 382 - S8 107.0 6.63 207.0 657 - S9 14.0 14.60 95.8 364 - 均值 55.3 9.92 144.0 468 -  下载: 导出CSV
表 2 广东沿海沉积物中多环芳烃含量
Table 2 PAHs concentrations in surface sediments along coastal waters in Guangdong
研究地点(年)
sampling site (year)测定PAHs数量
number of PAHs质量分数/μg·kg-1
concentration均值/μg·kg-1
average参考文献
Reference牡蛎塭养区(2015)oyster ponds 16 234~615 322 该研究 牡蛎塭养水源区(2015)outside oyster ponds 16 364~657 468 该研究 红海湾(2007)Honghai Bay 16 65.14~562.20 225.20 [19] 南澳岛(2010)Nan′ao Island 16 117.0~342.8 210.4 [17] 柘林湾(2004)Zhelin Bay 16 146~929 477 [20] 珠江口(2015)Pearl River 16 126.08~3 828.58 563.52 [21] 大鹏湾(2011)Dapeng Bay 16 216.6~1 314.9 572.7 [17] 湛江湾(2012)Zhanjiang Bay 16 41.96~933.90 315.98 [22] 雷州湾(2012)Louzhou Bay 16 21.72~319.61 103.91 [22] 博贺湾(2010)Bohe Bay 16 226.9~313.0 279.4 [17] 流沙湾(2010)Liusha Bay 16 186.5~300.9 239.8 [17]
下载: 导出CSV
表 3 塭养区沉积物中多环芳烃生态风险评价
Table 3 Ecological risk assessment of PAHs in sediment from marine pond culture zone
化合物
compound效应区间低值
ERL效应区间中值
ERM质量分数/μg·kg-1
content萘NA 160 2 100 9.21~43.7 苊烯ACL 44 640 1.54~6.09 苊AC 16 500 2.85~13.4 芴FL 19 540 43.1~129 菲PHE 240 1 500 88.5~231 蒽AN 85.3 1 100 34.8~98.8 荧蒽FA 600 5 100 19.0~49.1 芘PY 665 2 600 12.6~34.2 苯并[a]蒽BaA 261 1 600 3.29~13.7 CHR 384 2 800 3.37~13.5 苯并[b]荧蒽BbFA - - 1.04~5.64 苯并[k]荧蒽BkFA - - 0.896~4.10 苯并[a]芘BaP 430 1 600 0.827~4.63 茚酚[1, 2, 3-cd]芘IP - - ND~0.807 二苯并[a, h]蒽DBahA 63.4 260 ND~0.249 苯并[g, h, i]苝BghiP - - ND~0.838 ∑PAHs 4 022 44 792 234~615 注:ND.未检出
Note:ND.not detected
下载: 导出CSV
-
[1] IARC. IARC Monographs on the evaluation of carcinogenic risks to humans. Vol. 32:polynuclear aromatic compounds, Part 1:chemical, environmental and experimental data [EB/OL].[2016-05-21].http: //monographs.iarc.fr/ENG/Monographs/vol1-42/mono32.pdf http://oem.bmj.com/content/vol42/issue3/
[2] USEPA. Toxic and priority pollutants under the clean water act, priority pollutant list [EB/OL].[2016-05-21].https: //www.epa.gov/sites/production/files/2015-09/documents/priority-pollutant-list-epa.pdf. https://www.epa.gov/cwa-methods
[3] XU S S, LIU W X, TAO S. Emission of polycyclic aromatic hydrocarbons in China [J]. Environ Sci Technol, 2006, 40(3):702-708. doi: 10.1021/es0517062
[4] FENG J, XI N, ZHANG F, et al. Distributions and potential sources of polycyclic aromatic hydrocarbons in surface sediments from an emerging industrial city (Xinxiang) [J]. Environ Monit Assess, 2016, 188(1):61-65. doi: 10.1007/s10661-015-5060-y
[5] ZHAO L, HOU H, SHANG G Y, et al.Occurrence, sources, and potential human health risks of polycyclic aromatic hydrocarbons in agricultural soils of the coal production area surrounding Xinzhou, China[J].Ecotoxicol Environ Saf, 2014, 108:120-128. doi: 10.1016/j.ecoenv.2014.05.034
[6] ZHANG D L, AN T C, QIAO M, et al.Source identification and health risk of polycyclic aromatic hydrocarbons associated with electronic dismantling in Guiyu town, South China[J].J Hazard Mater, 2011, 192(1):1-7. https://core.ac.uk/display/71722013
[7] YUAN G, WU M, SUN Y, et al. One century of air deposition of hydrocarbons recorded in travertine in North Tibetan Plateau, China:sources and evolution [J]. Sci Total Environ, 2016, 560/561:212-217. doi: 10.1016/j.scitotenv.2016.03.227
[8] BOZLAKER A, MUEZZINOGLU A, ODABASI M.Atmospheric concentrations, dry deposition and air-soil exchange of polycyclic aromatic hydrocarbons (PAHs) in an industrial region in Turkey[J].J Hazard Mater, 2008, 153(3):1093-1102. doi: 10.1016/j.jhazmat.2007.09.064
[9] LIU L Y, WANG J Z, WEI G L, et al.Sediment records of polycyclic aromatic hydrocarbons (PAHs) in the continental shelf of China:implications for evolving anthropogenic impacts[J].Environ Sci Technol, 2012, 46(12):6497-6504. doi: 10.1021/es300474z
[10] LI P, XUE R, WANG Y, et al.Influence of anthropogenic activities on PAHs in sediments in a significant gulf of low-latitude developing regions, the Beibu Gulf, South China Sea:distribution, sources, inventory and probability risk[J].Mar Pollut Bull, 2015, 90(1/2):218-226. https://www.sciencedirect.com/science/article/pii/S0025326X14007322
[11] KANZARI F, SYAKTI A D, ASIA L, et al. Distributions and sources of persistent organic pollutants (aliphatic hydrocarbons, PAHs, PCBs and pesticides) in surface sediments of an industrialized urban river (Huveaune), France[J]. Sci Total Environ, 2014(478):41-151. https://www.sciencedirect.com/science/article/pii/S0048969714000746
[12] ORES D R, ROSS J R M, SPIES R B, et al. Polycyclic aromatic hydrocarbon (PAH) contamination in San Francisco Bay:a 10-year retrospective of monitoring in an urbanized estuary[J]. Environ Res, 2007, 105(1):101-118. https://www.sciencedirect.com/science/article/pii/S0013935106002337
[13] 谢文平, 朱新平, 郑光明, 等.广东罗非鱼养殖区水体及鱼体中多环芳烃的含量与健康风险[J].农业环境科学学报, 2014, 33(12):2450-2456. doi: 10.11654/jaes.2014.12.024 [14] 张春辉. 广东沿海食用鱼中持久性有机污染物的生物累积与健康风险评价[D]. 贵阳: 贵州大学, 2015: 56-57. http://cdmd.cnki.com.cn/Article/CDMD-10657-1015910587.htm [15] 苏惠, 蔡友琼, 于慧娟, 等.中国部分沿海海域牡蛎体内多环芳烃和多氯联苯的空间分布及组分特征[J].食品科学, 2012, 33(10):218-222. http://www.cnki.com.cn/Article/CJFDTOTAL-SPKX201210046.htm [16] 农业部渔业局.中国渔业统计年鉴[M].北京:中国农业出版社, 2014:35. [17] 卢腾腾. 广东沿海沉积物中的多环芳烃及其生态风险评价研究[D]. 上海: 上海海洋大学, 2012: 19-28. http://www.cnki.com.cn/Article/CJFDTOTAL-SPKX201210046.htm [18] 中华人民共和国农业部. SC/T 3042—2008水产品中16种多环芳烃的测定气相色谱-质谱法[S]. 北京: 中国标准出版社, 2008: 2-5. http://www.cnki.com.cn/Article/CJFDTOTAL-TEST200909007.htm [19] 朱文锋. 广东省沿海表层沉积物中多环芳烃研究[D]. 广州: 中国科学院广州地球化学研究所, 2007: 24. http://cdmd.cnki.com.cn/Article/CDMD-80165-2007101547.htm [20] 黄宏. 粤东沿海及舟山群岛多环芳烃污染调查研究[D]. 汕头: 汕头大学, 2006: 25-26. http://cdmd.cnki.com.cn/Article/CDMD-10560-2006173095.htm [21] ZHANG J D, WANG Y S, CHENG H, et al.Distribution and sources of the polycyclic aromatic hydrocarbons in the sediments of the Pearl River estuary, China[J].Ecotoxicology, 2015, 24(7/8):1643-1649. https://www.researchgate.net/profile/You_Shao_Wang/publication...
[22] HUANG W, WANG Z, YAN W. Distribution and sources of polycyclic aromatic hydrocarbons (PAHs) in sediments from Zhanjiang Bay and Leizhou Bay, South China[J]. Mar Pollut Bull, 2012, 64 (9):1962-1969. doi: 10.1016/j.marpolbul.2012.05.023
[23] YUNKER M B, MACDONALD R W, VINGARZAN R, et al.PAHs in the Fraser River basin:a critical appraisal of PAH ratios as indicators of PAH source and composition[J].Org Geochem, 2002, 33(4):489-515. doi: 10.1016/S0146-6380(02)00002-5
[24] ZHANG J D, WANG Y S, CHENG H, et al. Sources appointment and ecological risk assessment of polycyclic aromatic hydrocarbons (PAHs) in sediments of Erhai Lake, a low-latitude and high-altitude lake in southwest China[J]. Environ Sci Pollut Res Int, 2016, 23(5):4430-4441. doi: 10.1007/s11356-015-5626-9
[25] BRUNET C, CASOTTI R, VANTREPOTTE V, et al. Vertical variability and diel dynamics of picophytoplankton in the Strait of Sicily, Mediterranean Sea, in summer[J]. Mar Ecol Prog Ser, 2007, 346:15-26. doi: 10.3354/meps07017
[26] GAO K S, WALTER HELBLING E, HAEDER D P, et al.Responses of marine primary producers to interactions between ocean acidification, solar radiation, and warming[J].Mar Ecol Prog Ser, 2012, 470:167-189. doi: 10.3354/meps10043
[27] LUO X J, CHEN S J, MAI B X, et al. Polycyclic aromatic hydrocarbons in suspended particulate matter and sediments from the Pearl River Estuary and adjacent coastal areas, China[J]. Environ Pollut, 2006, 139(1):9-20. doi: 10.1016/j.envpol.2005.05.001
[28] GU Y G, LIN Q, LU T T, et al.Levels, composition profiles and sources of polycyclic aromatic hydrocarbons in surface sediments from Nan′ao Island, a representative mariculture base in South China[J].Mar Pollut Bull, 2013, 75(1/2):310-316. http://www.sciencedirect.com/science/article/pii/S0025326X13004268
[29] 广东省统计局.广东统计年鉴[M].北京:中国统计出版社, 2015:7-5. [30] LONG E R, MACDONALD D D, SMITH S L, et al. Incidence of adverse biological effects within ranges of chemical concentrations in marine and estuarine sediments[J]. Environ Manag, 1995, 19(1):81-97. doi: 10.1007/BF02472006
[31] ZHENG X, HAN B, THAYAMANI P, et al. Composition, source identification and ecological risk assessment of polycyclic aromatic hydrocarbons in surface sediments of the Subei Grand Canal, China[J]. Environ Earth Sci, 2015, 74(3):2669-2677. doi: 10.1007/s12665-015-4287-9
[32] SUN R X, LIN Q, KE C L, et al.Polycyclic aromatic hydrocarbons in surface sediments and marine organisms from the Daya Bay, South China[J].Mar Pollut Bull, 2016, 103(1/2):325-332. https://www.researchgate.net/publication/290480252_Polycyclic...
[33] 孙闰霞, 林钦, 柯常亮, 等.海洋生物体多环芳烃污染残留及其健康风险评价研究[J].南方水产科学, 2012, 8(3):71-78. http://www.schinafish.cn/CN/abstract/abstract8948.shtml [34] 窦勇, 乔秀亭, 陈丽梅, 等.萘暴露对环文蛤的氧化胁迫与损伤研究[J].南方水产科学, 2014, 10(4):39-44. http://www.schinafish.cn/CN/abstract/abstract9150.shtml [35] USEPA. Guidance for assessing chemical contaminant data for use in fish advisories volume 1:fish sampling and analysis EPA 823-B-00-007[S].3rd ed.Washington, D.C.:United States Environmental Protection Agency, 2000.
[36] GENTRIC C, REHEL K, DUFOUR A, et al.Bioaccumulation of metallic trace elements and organic pollutants in marine sponges from the South Brittany Coast, France[J].J Environ Sci Health A Tox Hazard Subst Environ Eng, 2016, 51(3):213-219. doi: 10.1080/10934529.2015.1094327
[37] NAKATA H, KOBAYASHI S, HIRAYAMA Y, et al. Contamination of organochlorines, polycyclic aromatic hydrocarbons and organ otin in coastal shellfishes from the ariake sea and the effects of tributyltin on imposex induction in rock shells[J]. Nippon Suisan Gakkaishi, 2004, 70(4):555-566. doi: 10.2331/suisan.70.555


计量
- 文章访问数: 3580
- HTML全文浏览量: 1035
- PDF下载量: 796
 粤公网安备 44010502001741号
