
Genetic variation of mtDNA COI sequence of Scomberomorus commerson populations in the South China Sea
-
摘要:
在测定的采自广东饶平、阳江和广西东兴海域的62尾康氏马鲛(Scomberomorus commerson)线粒体COI基因711 bp序列中,共检测到26个变异位点,18个单倍型,总体呈现出高单倍型多样性(Hd=0.808±0.040)和低核苷酸多样性(π=0.004 0±0.000 6)的特点。邻接树上出现了3个分支,分支间Fst为0.811~0.833且P<0.001,Nm为0.1~0.117;AMOVA分析显示分支间遗传变异占82.61%。表明3个分支间分化程度高,推测分歧时间为(89~22.67)万年前中更新世时期,可能原因是受到更新世冰期和间冰期交替的影响。但分支内与分支间都有不同地理来源的个体,没有出现明显的地理聚群;不同地理群体间Fst为-0.027~0.066,Nm均大于4或小于0;群体内个体间变异为96.34%。均表明群体间基因交流频繁,遗传分化程度并不高。3个分支中Clade A分支经历过种群快速扩张事件,可能是末次冰期期间康氏马鲛进入外海并受洋流及生存空间改变的影响。
Abstract:We analyzed 711 bp segment of the mtDNA cytochrome oxidase subunit Ⅰ of 62 individuals of Scomberomorus commerson collected from Raoping, Yangjiang in Guangdong Province and Dongxing in Guangxi Province, among which 26 mutations and 18 haplotypes were detected. Generally, the haplotype diversity (Hd=0.808±0.040) level was relatively high, while the nucleotide diversity was much poorer (π=0.004 0±0.000 6). Three shallow clades appeared in the Kimura 2-parameter based on neighbor-joining tree and parsimony network; pairwise fixation index Fst value ranged from 0.811 to 0.833 (P<0.001); gene flow ranged from 0.1 to 0.117. Analysis of molecular variance shows that the genetic variation among three clades was 82.61%, suggesting significantly high genetic differentiation. The deduced divergence time was about 890~226.7 ka BP (i.e., during the middle Pleistocene period), and the Glacial interglacial cycles in Pleistocene might be the reason of genetic differentiation. However, individuals from various locations were intertwined together in all clades; pairwise Fst (-0.027~0.066) and gene flow among sampling sites revealed no significant differentiation. AMOVA analysis shows that the percentage of population variation was 96.34%, suggesting a relatively high level of gene flow among sampling sites in the South China Sea. In Clade A, the significant negative values of neutral test and the unimodal mismatch distribution suggest a recent population expansion occurred in this clade about 890 000~226 700 years ago, due to the effects of changed living space and marine currents during Pleistocene glaciations.
-
长吻

1. 材料与方法
1.1 材料
1.1.1 试验鱼
标本于2008年6~8月分别采自湖南岳阳洞庭湖水产品批发市场(简称D)和湖南省鱼类原种场(简称Y)野生群体共计10尾,活鱼用氧气袋运回实验室后暂养。试验鱼平均全长(28.57±0.50)cm,平均体长(18.76±0.48)cm,平均体质量(1 000.43±7.80)g。
1.1.2 主要试剂和仪器
30条10 bp S系列随机引物、蛋白酶K、琼脂糖、Taq DNA酶、dNTPs等购自上海生工生物工程技术服务有限公司;冷冻离心机、PCR扩增仪、凝胶成像系统、电泳仪等常规仪器均为国产。
1.2 方法
1.2.1 基因组DNA的提取
剪取每尾鱼背部肌肉组织约100 mg于预冷研钵内,加液氮研磨成粉末状,加入蒸馏水、TE缓冲液(10 mmol·L-1Tris-HCl,10 mmol·L-1 EDTA,pH 8.0)浸泡,然后离心2 min,除去浸泡液。向离心管中加入700 μL的STE溶液(10 mmol·L-1Tris-HCl、10 mmol·L-1 EDTA、70 μL的10% SDS、100 mmol·L-1 NaCl)和10 μL的蛋白酶K(20 mg·mL-1)轻轻颠倒混匀,于56 ℃震荡温育过夜。10 mg·mL-1 RNase,然后依次用Tris饱和酚V(酚): V(氯仿): V(异戊醇)=25:24:1和V(氯仿): V(异戊醇)=24:1抽提,再分别用无水乙醇和70%乙醇沉淀DNA待烘干,加入90 μL TE缓冲以液溶解沉淀DNA,-20 ℃保存。
1.2.2 RAPD反应
PCR反应总体系25 μL,其中2.5 μL 10×PCR Buffer,1.0 μL 25 mmol·L-1 Mg2+,2.0 μL 2.5 mmol·L-1 dNTP,0.6 μL 20 mmol·L-1引物,1.5 U·μL-1 Taq DNA聚合酶,50 ng DNA,ddH2O补足至25 μL。PCR扩增反应程序为94 ℃预变性5 min,共40个循环,其中每个循环包括94 ℃ 1 min,36 ℃ 1 min,72 ℃ 2 min,循环结束后,72 ℃延伸5 min,4 ℃保存。
1.2.3 引物的筛选
购自上海生工30个引物以扩增条带的有无、强弱、个体内一致性和个体间的多态性等为标准,并对10 bp的随机引物和所有个体的基因组DNA进行筛选和扩增。取5 μL扩增产物经1.2%琼脂糖凝胶电泳,EB染色后于紫外透射仪下观察并照相。
1.2.4 数据分析
根据RAPD产物的电泳带型,进行群体内和群体间的比较。在相同的迁移率上,出现的带记为1,未出现的带记为0。按LYNCH[5]公式Sxy=2Nxy/(Nx+Ny)计算个体间遗传相似系数,式中Nxy为个体X和Y的共有带数,Nx和Ny分别为个体X和Y的扩增带数。群体内的遗传相似系数(S)是群体内所有的2个体间相似性指数的平均值。群体间的电泳带共有度(Sij)为群体i中的个体和群体j中的个体两两个体间的相似性指数的平均值。用公式D=1-S计算群体间的遗传距离。Nei基因多样性指数(He)=∑(1-∑ pi2)/N,pi为第i个位点在种群中出现的频率,N为所测位点总数。多态位点比例P=多态位点数/位点总数×100[6]。
2. 结果与分析
试验共用了20个引物,其中17个引物产生了有效且结果稳定的扩增产物。共扩增出103条DNA片段,平均每条引物能产生5.15条带,扩增片段大小在0.2~3.0 kb。在检测出的103条带中,有43条带表现出多态性,其多态位点比例(P)为41.75%,引物的序列及扩增情况见表 1,部分引物的扩增图谱见图 1。
表 1 选取的20个引物的扩增结果Table 1. Amplification result of 20 selected arbitrary primers引物序号
primer No.引物序列5′~3′
5′~3′sequence位点总数
total loci多态位点数
polymorphic loci多态位点比例/%
proportion of polymorphic lociS101 GGTCGGGAGAA 9 3 33.33 S102 TCGGACGTCGG 5 2 40.00 S103 AGACGTCCAC 6 3 50.00 S104 GGAAGTCGCC 4 1 25.00 S105 AGTCGTCCCC 6 4 66.67 S106 CTGCATCGTG 3 2 50.00 S107 CTGCATCGTG 6 2 33.33 S108 GAAACACCCC 5 3 60.00 S111 CTTCCGCAGT 7 3 57.14 S114 ACCAGTTGG 4 2 50.00 S115 AATGGCGCAG 5 3 60.00 S118 GAATCGGCCA 4 1 25.00 S119 CTGACCAGCC 5 2 40.00 S122 GAGGATCCCT 7 3 42.86 S123 CCTGATCACC 8 2 25.00 S126 GGGAATTCGG 3 1 33.33 S127 CCGATATCCC 6 2 33.34 S132 ACGGTACCAG 4 2 50.00 S135 CCAGTACTCC 4 1 25.00 S136 GGAGTACTGG 2 1 50.00 总计total 103 43 41.75 ![]() 图 1 引物S103(a)和S123(b)对长吻
图 1 引物S103(a)和S123(b)对长吻洞庭湖和原种场2群体内各个体间和群体之间的遗传多样性结果分别为:洞庭湖区5个个体间的D为0.016 7~0.120 5,平均0.133 0;S为0.879 5~0.983 3,平均1.685 2;原种场5个个体间的D为0.031 9~0.110 8,平均0.147 2,S为0.879 4~0.989 2,平均1.689 2;2群体之间的D为0.016 7~0.301 7,平均0.088 9,S为0.798 3~0.999 4,平均0.917 8(表 2)。根据RAPD结果构建的原始数据矩阵,得出长吻
个体
individualN D1 N D2 N D3 N D4 N D5 N Y6 N Y7 N Y8 N Y9 N Y10 N D1 - 0.910 6 0.969 8 0.879 5 0.903 2 0.925 8 0.871 7 0.936 3 0.875 5 0.931 8 N D2 0.089 4 - 0.915 4 0.983 3 0.943 6 0.898 8 0.938 1 0.961 1 0.971 6 0.798 3 N D3 0.030 2 0.084 6 - 0.980 4 0.893 1 0.976 1 0.883 8 0.999 4 0.881 4 0.880 8 N D4 0.120 5 0.016 7 0.019 6 - 0.889 7 0.893 2 0.908 3 0.923 6 0.957 1 0.836 5 N D5 0.096 8 0.056 4 0.106 9 0.110 3 - 0.901 6 0.899 1 0.889 2 0.887 0 0.915 1 N Y6 0.074 2 0.101 2 0.023 9 0.106 8 0.098 4 - 0.957 5 0.968 1 0.943 2 0.931 9 N Y7 0.128 3 0.061 8 0.116 2 0.091 7 0.100 9 0.042 5 - 0.926 8 0.889 3 0.901 4 N Y8 0.063 7 0.038 9 0.100 6 0.076 4 0.110 8 0.031 9 0.073 2 - 0.903 7 0.989 2 N Y9 0.124 5 0.028 4 0.118 6 0.042 9 0.113 0 0.056 8 0.110 7 0.096 3 - 0.879 4 N Y10 0.068 2 0.301 7 0.119 2 0.163 5 0.084 9 0.068 1 0.098 6 0.110 8 0.120 6 - 注:对角线以上为遗传相似系数;对角线以下为遗传距离
Note:Genetic similarity coefficients are listed above the diagonal while genetic distances below the diagonal.3. 讨论
该研究所取的标本是具有代表性的物种个体,被研究对象来源可靠,分别采自于湖南洞庭湖和原种场的长吻
遗传多样性是指生物种内或种间的遗传变异,是生物适应环境与进化的基础[7]。就一个物种而言,种内遗传多样性愈丰富,该物种对环境变化的适应能力愈大其进化潜力也愈大[8]。对物种的遗传多样性及种群结构进行研究,是为了最大限度地维持种内的遗传多样性水平,维持物种和种群的自然繁殖能力、进化潜力,确保种质资源的持续利用[9]。
RAPD技术具有能够迅速提供遗传分析中大量遗传标记的特点,可以鉴别种、亚种、种群甚至个体之间的差异,因此可运用于鱼类群体内及群体间的遗传变异分析,较准确地揭示其遗传变异水平,在鱼类的遗传育种中起指导作用,其多态位点比例、遗传相似率高低等参数均能反映群体分化和变异的程度及种质资源状况[4]。群体间的D和种群分化指数是衡量群体多态程度的重要指标,两者的值越大,群体的多态性程度越高。在长吻
鱼类遗传多样性及其变化情况的研究是评估鱼类资源质量、建立鱼类人工繁殖科学管理规范的重要基础工作[11]。通过对一些野生物种的监测,可以评价自然灾害和人类生产活动的干预对野生种质资源所带来的遗传学变化,从而制定和采取相应的管理和保护措施。应大力开展长吻
-
![]()
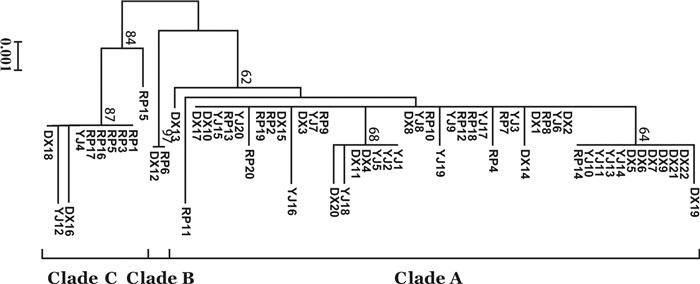
图 1 基于62尾康氏马鲛COI序列建立的邻接树
分支上数字只显示1 000次重抽样分析中大于60%的支持率
Figure 1. Neighbor-joining tree based on 62 mtDNA COI sequences of S. commerson
The supporting rate>60% bootstrap supported in 1 000 replicates are shown on branches.
![]()
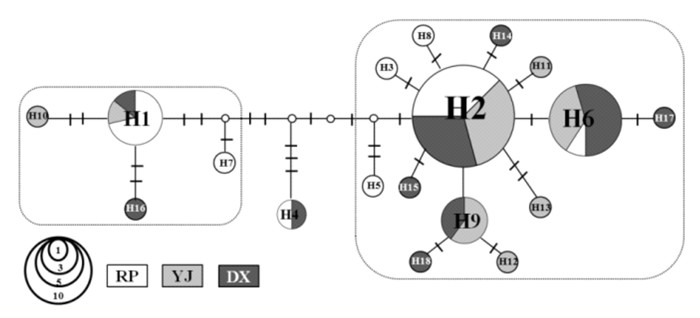
图 2 南海康氏马鲛COI基因单倍型网络
每个饼图代表一个特有单倍型及其共享该单倍型的个体数;饼图同背景色及其面积表示地理来源及其相对丰度及其枝上短线为突变步数,RP,YJ和DX分别代表饶平、阳江和东兴;矩形框表示不同的单倍型组。
Figure 2. Parsimony network of COI haplotypes of S. commerson in the South China Sea
Each pie represents a unique haplotype and the number of included individuals. Small open circles represent haplotypes that were not sampled in the study. A dash on line indicates a mutation step. Sampling sites are color-coded and abbreviated as RP for Raoping, YJ for Yangjiang and DX for Dongxin, and the size of colored area indicates its relative abundance. Rectangle blocks represent haplotype groups.
![]()
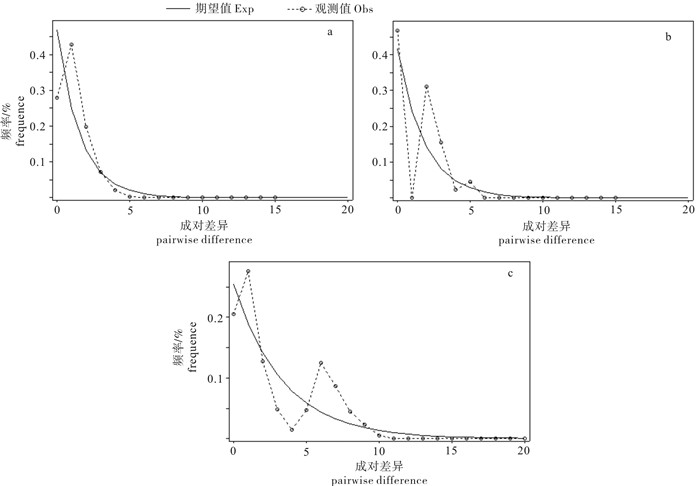
图 3 康氏马鲛核苷酸不配对分析图
a. Clade A;b. Clade C;c. 整体
Figure 3. Nucleotide mismatch distribution of S. commerson
a. Clade A; b. Clade C; c. overall individuals
表 1 中国南海康氏马鲛的遗传多样性指数
Table 1 Genetic diversity parameters of S. commerson populations in the South China Sea
群体
population经纬度
longitude and latitude数量
n单倍型数
N变异位点数
variable site单倍型多样性
Hd核苷酸多样性
π饶平(RP) 117.01°E,23.67°N 20 8 15 0.758±0.081 0.004 8±0.000 7 阳江(YJ) 111.99°E,21.82°N 20 8 14 0.805±0.070 0.003 2±0.001 0 东兴(DX) 108.10°E,21.55°N 22 10 15 0.840±0.057 0.003 6±0.001 0 Clade A 50 13 15 0.722±0.055 0.001 5±0.000 2 Clade B 2 1 0 - - Clade C 10 4 7 0.533±0.180 0.001 9±0.000 8 总体total 62 18 26 0.808±0.040 0.004 0±0.000 6 注:n. 数量;N. 单倍型数;Hd. 单倍型多样性;π. 核苷酸多样性;Clade A~C表示邻接树上3个分支
Note:n. number of samples;N. number of haplotypes;Hd. haplotype diversity;π. nucleotide diversity;Clade A,Clade B and Clade C represent three branches of neighbor-joining tree. 下载: 导出CSV
表 2 康氏马鲛地理群体间及分支间遗传分化系数(Fst)和基因流(Nm)
Table 2 Pairwise differentiation (Fst) and gene flow (Nm) among sampling sites and clades of S. commerson
Nm
Fst饶平
RP阳江
YJ东兴
DXClade A Clade B Clade C Clade A
RPClade A
YJClade A
DX饶平RP 7.076 8.121 阳江YJ 0.066* -19.018 东兴DX 0.058 -0.027 Clade A 0.117 0.105 Clade B 0.811*** 0.100 Clade C 0.827*** 0.833** Clade A(RP) 11.695 6.746 Clade A(YJ) 0.041 -36.214 Clade A(DX) 0.069* -0.014 注:*. 0.01<P<0.05;**. 0.001<P<0.01;***. P<0.001
下载: 导出CSV
表 3 中国南海康氏马鲛的分子方差分析
Table 3 Analysis of molecular variance (AMOVA) of S. commerson in the South China Sea
序号
ordinal分组
group项目
item组群间
among groups组群内群体间
among populations within groups群体内
within populations总计
totalI group (RP,YJ,DX) 平方和 5.16 85.23 90.39 变异组成 0.05 1.45 1.50 变异比例 3.66 96.34 Ⅱ group1(琼州海峡东侧RP,YJ) group2(琼州海峡西侧DX) 平方和 1.53 3.63 85.23 90.39 变异组成 0.08 0.11 1.45 1.48 变异比例 -5.34 7.39 97.95 Ⅲ group (Clade A,Clade B,Clade C) 平方和 56.21 34.18 90.39 变异组成 2.75 0.58 3.33 变异比例 82.61 17.39 Ⅳ group (Clade A RP,Clade A YJ、Clade A DX) 平方和 1.57 25.33 26.90 变异组成 0.02 0.53 0.55 变异比例 2.69 97.31 注:Ⅰ. 将康氏马鲛3个地理群体作为1组;Ⅱ. 按琼州海峡两侧分组;Ⅲ. 将3个分支作为1组;Ⅳ. 将Clade A分支中3个地理群体作为1组
Note:Ⅰ. three populations as a whole;Ⅱ. two groups on either sides of Qiongzhou Strait;Ⅲ. cladewise;Ⅳ. three populations of Clade A as a whole
下载: 导出CSV
表 4 康氏马鲛的中性检验、不配对分布
Table 4 Neutrality tests and mismatches distribution of S. commerson
群体
populationTajima′s D Fu′s Fs R2 P SSD P Rg P D P Fs P 饶平RP -0.553 0.31 -0.286 0.50 0.13 0.08 0.06 0.08 0.11 0.22 阳江YJ -1.425 0.06 -1.558 0.20 0.19 0.22 0.02 0.17 0.07 0.47 东兴DX -1.254 0.11 -2.856 0.05 0.24 0.06 0.03 0.10 0.08 0.44 Clade A -2.025 0.003 -8.935 0 0.10 0.04 0.01 0.29 0.09 0.14 Clade B - - - - - - - - - - Clade C -1.839 0.008 -0.175 0.38 0.12 0.23 0.41 0 0.36 0.97 总体total -1.077 0.16 -1.567 0.25 0.16 0.14 0.04 0.12 0.09 0.38
下载: 导出CSV
-
[1] COLLETTE B B, RUSSO J L. Morphology, systematics and biology of the Spanish mackerel (Scomberomorus, Scombridae)[J]. Fish Bull, 1984, 82(4): 545-692.
[2] 陈再超, 刘继兴. 南海经济鱼类[M]. 广州: 广东科技出版社, 1982: 216-221. [3] FAUVELOT C, BORSA P. Patterns of genetic isolation in a widely distributed pelagic fish, the narrow-barred Spanish mackerel (Scomberomorus commerson)[J]. Biol J Linnean Soc, 2011, 104(4): 886-902. doi: 10.1111/j.1095-8312.2011.01754.x
[4] LI W, CHEN X, XU Q, et al. Genetic population structure of Thunnus albacares in the Central Pacific Ocean based on mtDNA COI gene sequences[J]. Biochem Genet, 2015, 53(1/2/3): 8-22. doi: 10.1007/s10528-015-9666-0
[5] KUMAR G, KUNAL S P. Historic demography and phylogenetic relationship of Euthynnus species based on COI sequence analyses[J]. Int J Bioinform Res Appl, 2013, 9(5): 547-555. doi: 10.1504/IJBRA.2013.056088
[6] 薛丹, 章群, 郜星晨, 等. 基于线粒体控制区的粤闽三线矶鲈地理群体的遗传变异分析[J]. 海洋渔业, 2014, 36(6): 496-502. doi: 10.3969/j.issn.1004-2490.2014.06.003 [7] HOOLIHAN J P, ANANDH P, van HERWERDEN L. Mitochond-rial DNA analyses of narrow-barred Spanish mackerel (Scomberomorus commerson) suggest a single genetic stock in the ROPME sea area (Arabian Gulf, Gulf of Oman, and Arabian Sea)[J]. ICES J Mar Sci, 2006, 63(6): 1066-1074. doi: 10.1016/j.icesjms.2006.03.012
[8] SULAIMAN Z H, OVENDEN J R. Population genetic evidence for the East-West division of the narrow-barred Spanish mackerel (Scomberomorus commerson, Perciformes: Teleostei) along Wallace's Line[J]. Biodivers Conserv, 2010, 19(2): 563-574. doi: 10.1007/s10531-009-9699-y
[9] van HERWERDEN L, MCILWAIN J, AL-OUFI H, et al. Development and application of microsatellite markers for Scomberomorus commerson (Perciformes; Teleostei) to a population genetic study of Arabian Peninsula stocks[J]. Fish Res, 2006, 79(3): 258-266. doi: 10.1016/j.fishres.2006.04.004
[10] 杨炳忠, 杨吝, 谭永光, 等. 马鲛体型特征与网目尺寸关系的初步探讨[J]. 南方水产科学, 2013, 9(5): 120-125. doi: 10.3969/j.issn.2095-0780.2013.05.018 [11] MULVEY M, LIU H P, KANDL K. Application of molecular genetic markers to conservation of freshwater bivalves[J]. J Shellfish Res, 1998, 17(5): 1395-1405.
[12] TAKESHIMA H, IGUCHI K, NISHIDA M. Unexpected ceiling of genetic differentiation in the control region of the mitochondrial DNA between different subspecies of the Ayu Plecoglossus altivelis[J]. Zool Sci, 2005, 22(4): 401-410. doi: 10.2108/zsj.22.401
[13] HEBERT P N, CYWINSKA A, BALL S L, et al. Biological identifications through DNA barcodes[J]. Proc Royal Soc London Biol Sci, 2003, 270(1512): 313-321. doi: 10.1098/rspb.2002.2218
[14] WARD R D, ZEMLAK T S, INNES B H, et al. DNA barcoding Australia's fish species[J]. Philos Trans R Soc Lond B Biol Sci, 2005, 360(1462): 1847-1857. doi: 10.1098/rstb.2005.1716
[15] WANG L, SHI X F, SU Y Q, et al. Genetic divergence and historical demography in the endangered large yellow croaker revealed by mtDNA[J]. Biochem Syst Ecol, 2013, 46: 137-144. doi: 10.1016/j.bse.2012.09.021
[16] BENTLEY B P, HARVEY E S, NEWMAN S J, et al. Local genetic patchiness but no regional differences between Indo-West Pacific populations of the dogtooth tuna Gymnosarda unicolor[J]. Mar Ecol Prog Ser, 2014, 506: 267-277. doi: 10.3354/meps10819
[17] SUN P, YIN F, SHI Z, et al. Genetic structure of Silver pomfret (Pampus argenteus (Euphrasen, 1788)) in the Arabian Sea, Bay of Bengal, and South China Sea as indicated by mitochondrial COI gene sequences[J]. J Appl Ichthyol, 2013, 29(4): 733-737. doi: 10.1111/jai.12130
[18] 乐小亮, 章群, 赵爽, 等. 一种高效快速的鱼类标本基因组DNA提取方法[J]. 生物技术通报, 2010(2): 202-204. https://biotech.aiijournal.com/CN/abstract/abstract5369.shtml [19] TAMURA K, STECHER G, PETERSON D, et al. MEGA6: molecular evolutionary genetics analysis version 6.0[J]. Mol Biol Evol, 2013, 30(12): 2725-2729. doi: 10.1093/molbev/mst197
[20] BANDELT H J, FORSTER P, RÖHL A. Median-joining networks for inferring intraspecific phylogenies[J]. Mol Biol Evol, 1999, 16(1): 37-48. doi: 10.1093/oxfordjournals.molbev.a026036
[21] LIBRADO P, ROZAS J. DnaSP v5: a software for comprehensive analysis of DNA polymorphism data[J]. Bioinformatics, 2009, 25(11): 1451-1452. doi: 10.1093/bioinformatics/btp187
[22] RAMOS-ONSINS S E, ROZAS J. Statistical properties of new neutrality tests against population growth[J]. Mol Biol Evol, 2002, 19(12): 2092-2100. doi: 10.1093/oxfordjournals.molbev.a004034
[23] EXCOFFIER L, LAVAL G, SCHNEIDER S. Arlequin (version 3.0): an integrated software package for population genetics data analysis[J]. Evol Bioinform Online, 2005, 1: 47-50. https://pubmed.ncbi.nlm.nih.gov/19325852/
[24] KARTAVTSEV Y P, SHARINA S N, GOTO T A, et al. Sequence diversity at Cytochrome Oxidase 1 (Co-1) gene among sculpins (Scorpaeniformes, Cottidae) and some other scorpionfish of Russia Far East with phylogenetic and taxonomic insights[J]. Genes Genom, 2009, 31(2): 183-197. doi: 10.1007/BF03191151
[25] GRANDCOURT E M, ABDESSALAAM T, FRANCIS F, et al. Preliminary assessment of the biology and fishery for the narrow-barred Spanish mackerel, Scomberomorus commerson (Lacépède, 1800), in the southern Arabian Gulf[J]. Fish Res, 2005, 76(2): 277-290. doi: 10.1016/j.fishres.2005.07.001
[26] 茅晟懿, 朱小畏, 吴能友, 等. 南海北部末次冰盛期晚期以来冰融水与气候事件记录: 长链脂肪醇陆源输入指示[J]. 热带海洋学报, 2015, 34(2): 52-65. doi: 10.11978/j.issn.1009-5470.2015.02.007 [27] GRANT W S, BOWEN B W. Shallow population histories in deep evolutionary linages of marine fishes: insights from sardines and anchovies and lessons for conservation[J]. J Heredity, 1998, 89(5): 415-426.
[28] 高天翔, 毕潇潇, 赵林林, 等. 基于线粒体Cytb基因全序列的松江鲈群体遗传结构分析[J]. 水生生物学报, 2013, 37(2): 199-207. doi: 10.7541/2013.5 [29] 邓春兴. 基于COI基因序列的中国东南沿海四指马鲅属鱼类的遗传多样性分析[D]. 广州: 暨南大学, 2014: 27-28.https://www.zhangqiaokeyan.com/academic-degree-domestic_mphd_thesis/020311700237.html [30] NI G, LI Q, KONG L, et al. Comparative phylogeography in marginal seas of the northwestern Pacific[J]. Mol Ecol, 2014, 23(3): 534-548. doi: 10.1111/mec.12620
[31] HEWITT G. The genetic legacy of the Quaternary ice ages[J]. Nature, 2000, 405(6789): 907-913. https://www.nature.com/articles/35016000
[32] 薛丹, 章群, 郜星晨, 等. 基于线粒体控制区序列的南海北部近岸的遗传多样性[J]. 中国水产科学, 2015, 22(4): 749-756. [33] 毕潇潇. 松江鲈(Trachidermus fasciatus)种群的形态学与遗传学研究[D]. 青岛: 中国海洋大学, 2013: 98.https://www.xueweilunwen.com/doc/560659 [34] AVISE J C. Phylogeography: the history and formation of species[M]. London: London Harvard University Press, 2000: 9-32.
-
期刊类型引用(6)
1. 刘童,王英俊,吴莹莹,邹琰,吕芳,吴海一,李建民,宋爱环. 魁蚶3个群体及杂交子代遗传多样性分析. 水产科学. 2024(04): 561-570 .  百度学术
百度学术
2. 苏尚柯,杜建国,陈彬,谭红建,杨雯,丁丽可,董鹏,俞炜炜,胡文佳. 气候变化对中国近海8种中上层鱼类潜在生境分布的影响. 生态学报. 2022(12): 4834-4846 . 百度学术
3. 柯宏基,李向民,陈傅晓,樊佳伟,王永波,谭围. 基于COⅠ序列的海南岛8个弹涂鱼群体遗传多样性研究. 海洋渔业. 2020(02): 138-148 . 百度学术
4. 曹洋铭,王丛丛,徐豪,刘洋. 基于线粒体基因标记的中西太平洋鲣群体遗传学分析. 海洋渔业. 2020(05): 542-551 . 百度学术
5. 杨喜书,章群,薛丹,吕金磊,黄镇宇,卢丽锋. 中国近海细鳞鯻线粒体控制区的遗传多样性. 生态学报. 2018(05): 1852-1859 . 百度学术
6. 王桢璐,姚东林,谢少林,范兰芬,邹记兴,周爱国. 基于线粒体Cyt b和COⅠ基因序列的华南鲤群体遗传结构分析. 江苏农业科学. 2018(18): 179-183 . 百度学术
其他类型引用(4)

计量
- 文章访问数: 3530
- HTML全文浏览量: 213
- PDF下载量: 1111
- 被引次数: 10
 粤公网安备 44010502001741号
