
Population genetic structure and genetic diversity of frigate tuna (Auxis thazard) in the South China Sea
-
摘要:
利用线粒体控制区(Dloop区)全序列,对2013年3月~2015年4月采自中国南海6°N~20°N之间8个地理群体的200尾扁舵鲣(Auxis thazard)进行了种群遗传多样性和遗传结构分析。序列总长991 bp,包含184个多态性位点,定义了191个单倍型。遗传多样性分析表明,南海扁舵鲣总体呈现出很高的单倍型多样性(0.999 5±0.000 6)和较高的核苷酸多样性(0.019±0.009)。系统发育分析、分子方差分析和成对遗传分化系数(FST)分析显示,南海范围内扁舵鲣不存在与地理群体对应的支系,群体间存在很强的基因流,遗传分化不显著。种群动态的中性检验和核苷酸不配对分布分析表明,南海扁舵鲣历史上曾经历过种群的快速扩张。结果表明,南海扁舵鲣遗传多样性丰富,具备较高的生态适应和进化能力;南海扁舵鲣属于同一个随机交配的种群,在渔业开发和管理上可视为一个单一的管理单元。
Abstract:We examined the population genetic structure and genetic diversity of the frigate tuna (Auxis thazard) in the South China Sea based on mitochondrial control region (Dloop) sequences, using a total of 200 individuals collected from eight sites (6°N~20°N) during March 2013 and April 2015. Fragments of 911 bp were sequenced and a total of 184 polymorphic sites were detected, which defined 191 haplotypes. Genetic diversity analysis shows that A.thazard in the South China Sea were characterized by rather high haplotype diversity (0.999 5±0.000 6) and high nucleotide diversity (0.019±0.009). Phylogenetic analysis reveals no significant genealogical clades of samples corresponding to sampling localities. Analyses of molecular variance and pairwise FST suggest a high rate of gene flow and the lack of genetic differentiation among different populations. Both neutrality tests and mismatch distribution analyses indicate a recent population expansion in A.thazard. It is demonstrated that A.thazard in the South China Sea belong to the same population, with strong adaptive capacity and evolutionary potential due to its high genetic diversity. Thus a single-stock management regime could be supported in fishery exploitation and management.
-
扁舵鲣(Auxis thazard)属于暖水性中上层洄游的小型金枪鱼类,广泛分布于太平洋、大西洋、印度洋的热带和亚热带海域[1-2],是一种繁殖力强、有较高经济价值的鱼类。近年来,在全球大型金枪鱼类充分开发的背景下,小型金枪鱼类资源的利用受到广泛关注,目前全世界扁舵鲣产量逐年攀升,2013年已超过12×104 t[3]。
近年来的灯光罩网探捕[4-8]发现南海海域蕴藏着丰富的扁舵鲣资源,中国水产科学研究院南海水产研究所声学资源评估显示其资源量在30×104 t以上,而目前中国捕捞量很少,属于轻度开发的鱼类资源(内部通讯)。因此,在当前近海鱼类资源严重衰退的情况下,对南海外海扁舵鲣这类小型金枪鱼类的开发是转移近海捕捞压力的出路之一。
在渔业资源的开发和管理中,需要根据种群的划分来分配不同作业区域的捕捞强度[9-10],也需要对种群的遗传多样性进行持续监测以防止种质衰退或灭绝[11]。另外,由于周边国家的介入,南海海域渔业形势复杂,对渔业资源种群的判别和划分是将来进行跨界鱼类种群的养护与管理的基础。关于扁舵鲣的研究多见于生长发育[12-14]、资源生物学[15-16]等方面,对其种群遗传特征的研究较少,目前仅对苏禄海-西里伯斯海[17]以及印度洋[18-19]的扁舵鲣做过相关的研究,这些研究为当地扁舵鲣渔业的开发和管理提供了科学的信息。而有关南海扁舵鲣资源遗传结构的研究目前尚未见报道,因此,文章利用变异快、多态性高、广泛应用于种内遗传结构分析的线粒体控制区(Dloop区)序列,对南海扁舵鲣的种群遗传结构和遗传多样性进行评估,以期为资源的开发、管理和可持续利用提供理论依据,也可为将来的跨界资源管理和捕捞配额谈判争取主动权。
1. 材料与方法
1.1 样本采集
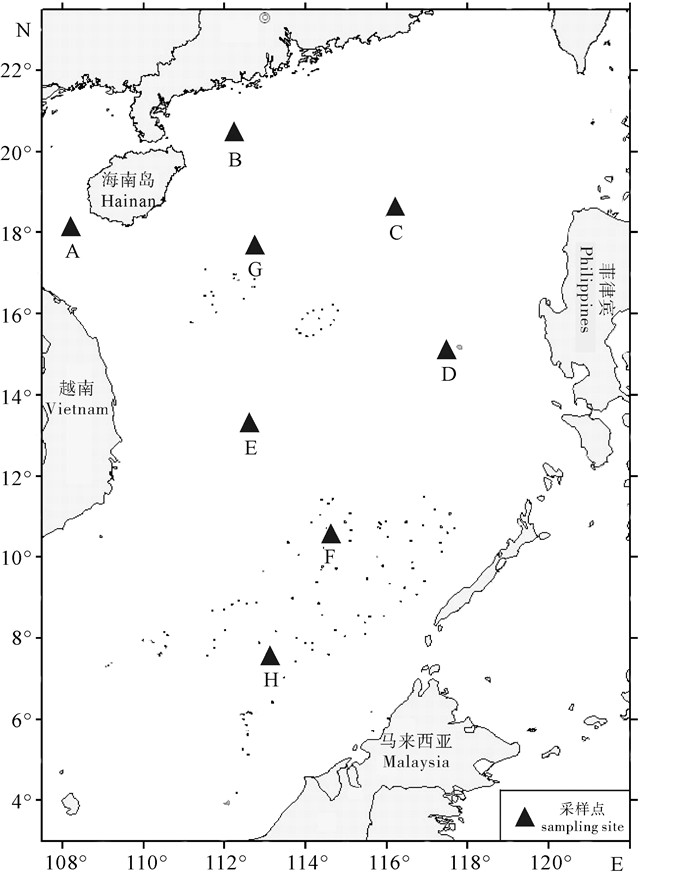
扁舵鲣样本于2013年3月至2015年4月通过灯光罩网渔船采集后冰冻带回实验室,经形态学鉴定和生物学测量后剪取背部肌肉-20 ℃保存。一共选取了南海6°N~20°N之间8个采样点的200尾进行实验。采样点位置见图 1,样本采集位点经纬度、采集时间及每个位点样本量见表 1。
表 1 南海扁舵鲣样本信息及遗传多样性统计数据Table 1. Sampling information and descriptive statistics of genetic diversity of A.thazard采样点
sampling site经度/纬度
longitude/latitude采样时间
date of sampling样本量(N)
number of samples单倍型数量(H)
number of haplotypes多态性位点数
(S)number of polymorphic sites单倍型多样性
(h±SD)haplotype diversity核苷酸多样性(π±SD)
nucleotide diversityA 108°03′E /18°12′N 2014-11-22 35 35 103 1.000 0±0.006 8 0.019 873±0.010 042 B 112°03′E /20°14′N 2014-11-28 27 25 74 0.994 3±0.011 9 0.017 537±0.008 989 C 116°03′E /18°25′N 2015-03-20 35 35 104 1.000 0±0.006 8 0.019 057±0.009 646 D 117°28′E /15°04′N 2013-04-05 35 35 101 1.000 0±0.006 8 0.020 306±0.010 252 E 112°23′E /13°30′N 2014-08-05 24 23 81 0.996 4±0.013 3 0.017 471±0.009 002 F 114°12′E /10°17′N 2014-05-20 34 34 106 1.000 0±0.007 1 0.020 069±0.010 147 G 112°46′E /17°48′N 2014-04-24 3 3 23 1.000 0±0.272 2 0.017 762±0.013 721 H 112°56′E / 7°34′N 2013-03-22 7 7 38 1.000 0±0.076 4 0.016 746±0.009 783 总计 total - - 200 191 184 0.999 5±0.000 6 0.019 133±0.009 447 1.2 实验方法
1.2.1 DNA的提取
采用海洋动物基因组DNA抽提试剂盒(天根,北京产)提取基因组DNA,1%的琼脂糖凝胶电泳检测DNA质量,NanoDrop8000超微量生物检测仪(ThermoFisher,美国产)检测DNA浓度。
1.2.2 目标片段的扩增及测序
根据GenBank中扁舵鲣线粒体基因组全序列(AB105447)设计1对Dloop区序列的扩增引物:Ath-Dloop-F(5′-ATGATCCTGCATTAGTAGCTCAGCG)和Ath-Dloop-R(5′-GTAAAGTCAGGACCAAGCCTTTGTG)。PCR反应体系总体积为50 μL,依照ExTaq酶(TaKaRa,大连产)的使用说明确定各组分的浓度。PCR反应在热循环仪(Eppendorf,德国产)上进行,反应条件如下:首先94 ℃预变性3 min,之后进行30个循环,每个循环包括94 ℃变性30 s、58 ℃退火30 s、72 ℃延伸1 min,最后72 ℃延伸5 min。扩增产物经电泳检验后,选取阳性产物进行双向序列测定,测序引物与扩增引物相同。
1.3 数据分析
1.3.1 序列编辑及进化模型确定
将测序获得的双向序列用DNAStar软件包中SeqMan组装,所有序列经BioEdit 3.3[20]编排后,用MEGA 6.0[21]中Clustal W比对并辅以手工校正。通过在GenBank上进行搜索比对确定其为扁舵鲣Dloop区序列。利用MEGA 6.0中Models模块进行核苷酸替代最适模型的筛选,基于最大似然法(Maximum Likelihood)标准从24种核苷酸替代模型中筛选出最适模型,即具有非变异位点(invariable sites)和Gamma参数(Gamma shape parameter)的Tamura三参数模型(Tamura 3-parameter),用于系统发生关系重建和群体遗传结构分析。
1.3.2 遗传多样性
各个采样点(地理群体)样本的遗传多样性指数如单倍型数目(H)、多态位点数目(S)、单倍型多样性(h)和核苷酸多样性(π)等通过软件Dnasp 5.0[22]和Arlequin 3.5[23]计算获得。
1.3.3 系统发育关系
使用MEGA 6.0基于邻接法(neighbor-joining,NJ)构建所有样本Dloop区序列的系统发育树。进化模型选择1.3.1中确定的Tamura三参数模型。将圆舵鲣(Auxis rochei)Dloop区同源序列作为系统分析的外类群,系统树各分支的可靠性采用1 000次重复抽样评估。由于种内水平个体间序列分歧度低而往往导致多分叉的(multi-furcation)群体基因谱系,重组或者平行突变还会产生网状结构。所以网状结构图(network)往往能更有效地描绘序列之间的关系[24]。该研究使用Splitstree 4[25]软件,利用Dloop区序列的简约信息位点构建邻接网络图(neighbor-net)。
1.3.4 种群遗传结构
采用分子方差分析(analysis of molecular variances,AMOVA)[26]来评价种群遗传变异水平与地理格局的相关性;通过计算两两群体间的分化固定指数FST来检验群体间遗传距离的大小;通过种群分化测试(exact test of population differentiation)进行随机交配群(population panmixia)假设即单倍型随机分布的检验。鉴于采样点G和H的样本量很小,因此在群体遗传结构(及种群历史动态)分析时作去除处理。上述分析计算均在Arlequin 3.5中进行,显著性用10 000次重复抽样来检验。
1.3.5 种群历史动态
在Arlequin 3.5中使用2种方法来检测南海扁舵鲣的种群历史动态,以检验种群历史上是否存在扩张事件。采用核苷酸不配对分布分析(mismatch distribution)[27-28],基于最小方差法来检验核苷酸不配对的观测值和群体扩张模型下的期望分布之间是否一致。模型的有效性由粗糙指数[29](Harpending′s raggedness index,HRI)进行评估。HRI的统计检验由10 000次重排获得,统计显著的HRI值表明观察值显著偏离预期模型。另外鉴于核苷酸不配对分布分析可能具有的保守性[30],采用2种中性检验(neutrality tests)方法:Tajima′s D检验[31]和Fu′s FS检验[32]来检测种群是否严格遵循进化上的中性理论。
运用BEAST 1.4.6软件[33],通过Bayesian Skyline Plot[34]运算来模拟扁舵鲣祖先有效种群大小随时间变化的趋势。运算所用的XML文件通过BEAUti V1.7.5[35]生成,Markov chain Monte Carlo运算(MCMC)设置为1×10⁷代,每1×10³代抽样检验。Dloop区进化速率(分子钟)采用之前相关研究普遍采用的每百万年3.6%的数值[36]。用Tracer 1.5[37]聚合各参数并作Bayesian Skyline Plot图。
2. 结果
2.1 序列特征及遗传多样性
共获得南海扁舵鲣8个地理群体200尾样本的线粒体Dloop区及tRNA-Pro全长序列,经对齐后长度为911 bp,在Dloop区5′端高变区发现有1个碱基位置的缺失。所有样本共检测到184个多态性位点,定义了191个单倍型。绝大多数单倍型(183个)属于个体特异单倍型,仅有8个单倍型属于共享单倍型,被2个或3个个体共享。各个地理群体的遗传多样性指数见表 1。由表可见,南海扁舵鲣总体反映出非常高的单倍型多样性(0.999 5±0.000 6)和较高的核苷酸多样性(0.019±0.009)。
2.2 系统发育关系
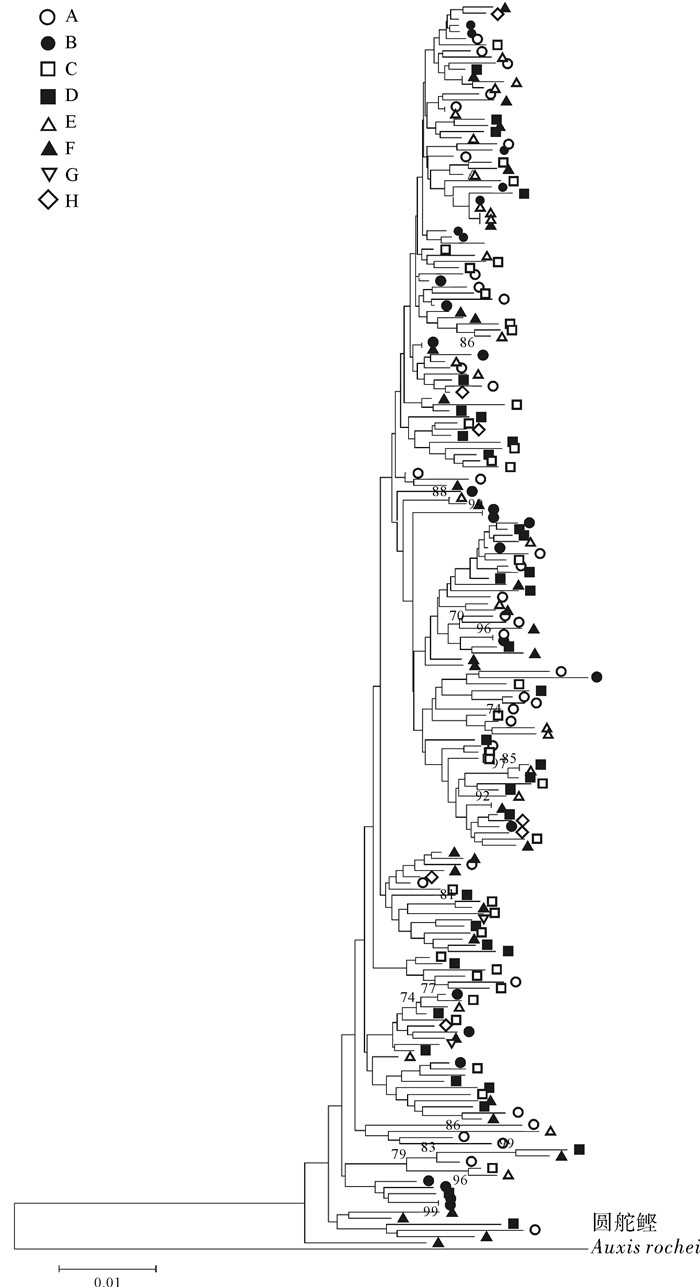
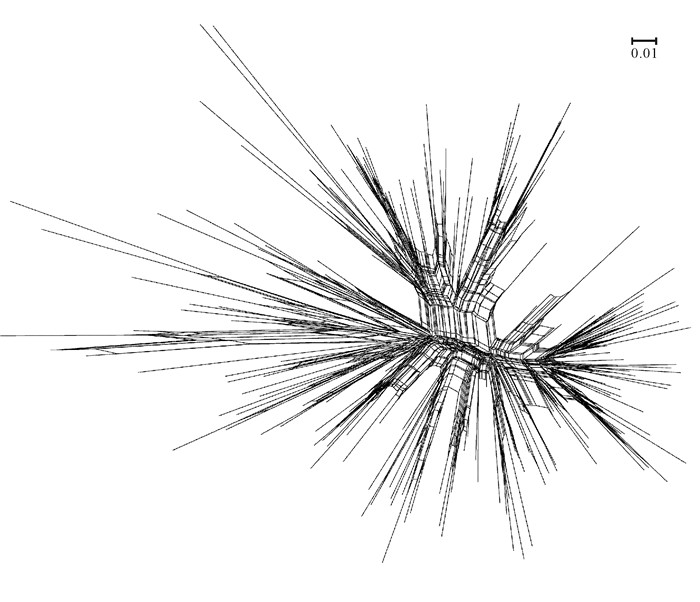
基于邻接法(NJ)以Tamura 3-parameter距离构建的扁舵鲣Dloop区单倍型的系统发育树见图 2。来自各个采样点的样本分散于NJ树的各个分叉之中,没有形成与地理群体对应的分支,系统树的拓扑结构很浅并且分支的支持率(自展值)均不高。利用Splitstree 4构建的扁舵鲣Dloop区序列邻接网络图见图 3,来自各地理群体的个体通过“树枝”和“网”连接成交错的网状结构,未形成明显的相互之间有距离的支系结构。
![]() 图 2 基于邻接法构建的扁舵鲣Dloop区单倍型系统发育树每一枝的末端代表来自不同采样点的样本;
图 2 基于邻接法构建的扁舵鲣Dloop区单倍型系统发育树每一枝的末端代表来自不同采样点的样本;
各分支标记大于50%的自展值Figure 2. Neighbour-joining tree for Dloop haplotypes of A.thazardThe tails of branches represent samples from different populations.
Bootstrap supports of >50% are shown at nodes.![]() 图 3 基于邻接网络法构建的扁舵鲣Dloop区序列进化网每一枝的末端代表一个个体,样本名省略Figure 3. Neighbor-net constructed from Dloop sequences of A.thazardThe tail of every branch represents one individual. (sample ID were omitted)
图 3 基于邻接网络法构建的扁舵鲣Dloop区序列进化网每一枝的末端代表一个个体,样本名省略Figure 3. Neighbor-net constructed from Dloop sequences of A.thazardThe tail of every branch represents one individual. (sample ID were omitted)2.3 种群遗传结构
AMOVA结果(表 2)显示,南海扁舵鲣Dloop区序列几乎所有的遗传差异(99.73%)均来源于群体内,群体间的遗传差异仅占所有遗传变异的极少部分。总体分化系数仅为0.002 7且不显著;两两地理群体间的FST值(表 3)大部分很小甚至是负值,并且所有FST值在统计意义上均不显著,表明群体间的遗传分化不明显。群体间随机交配的Exact test检验的P值(表 3)也显示,所有两两群体间均无显著差异,表明南海扁舵鲣群体符合随机交配群的假设。整体样本检测结果(P=1.00)也表明没有偏离这个假设,即暗示南海的扁舵鲣是一个随机交配的单一种群。
表 2 扁舵鲣地理群体遗传变异的分子方差分析Table 2. Analysis of molecular variance for populations of A.thazard变异来源
source of variation自由度
degree of freedom变异百分比
percentage of variation分化系数
F statisticsP 群体间among populations 5 0.27 FST= 0.002 7 0.218 9 群体内within populations 184 99.73 所有样本total 189 表 3 扁舵鲣两两地理群体间的遗传分化系数(对角线下方)及随机交配假设检验的显著性水平(对角线上方)Table 3. Pairwise FST (below diagonal) and non-differentiation exact P values (above diagonal) among geographic populations of A.thazard采样点
sampling siteA B C D E F A 0.513 35 1.000 00 1.000 00 0.729 45 1.000 00 B -0.003 00 0.209 60 0.220 20 0.315 55 0.460 45 C 0.006 32 0.014 17 1.000 00 0.507 40 1.000 00 D -0.001 58 0.006 53 0.001 62 0.475 20 1.000 00 E 0.009 37 0.001 87 0.010 16 0.013 13 1.000 00 F -0.004 54 0.000 44 -0.001 38 -0.006 31 0.003 31 2.4 种群历史动态
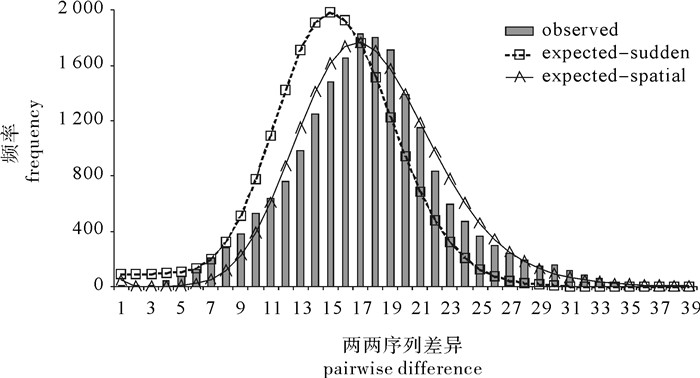
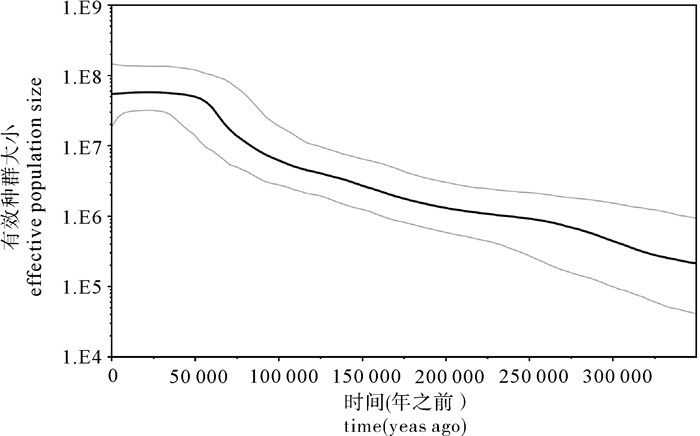
扁舵鲣各群体Dloop区序列核苷酸不配对分布分析结果见表 4。所有群体及样本总体的吻合度检验(goodness of fit test)均不显著(HRI值不显著,P>0.05),显示核苷酸不配对分布未偏离原假设(Rogers and Harpending的群体扩张模型)。总体样本的核苷酸不配对分布曲线呈明显的单峰形(图 4),观测值与群体扩张模型下的预期吻合,表明南海扁舵鲣历史上经历过种群扩张事件。中性检验的Tajima′s D和Fu′s FS值在绝大多数群体和样本总体中均呈现极显著或显著的负值(表 5),显著偏离中性理论下的Wright-Fisher模型,同样表明南海扁舵鲣历史上经历过种群的快速扩张。此外,Bayesian Skyline Plot曲线(图 5)显示,南海扁舵鲣的有效种群大小历史上经历过一个增长的阶段,种群扩张时间约在6万年之前,之后的有效种群大小则趋于稳定直至现在。
表 4 扁舵鲣Dloop区序列核苷酸不配对分布分析的参数估计值Table 4. Mismatch distribution parameter estimates for A.thazard based on D-loop sequence核苷酸不配对分布mismatch distribution 吻合度检验goodness-of-fit test 扩张时间
τ初始值
θ0最终值
θ1平方和
SSDP 粗糙指数
HRIP A 17.761 72 0 88.906 25 0.002 40 0.785 80 0.003 97 0.917 80 B 17.367 19 0 98.046 88 0.004 39 0.557 00 0.006 96 0.741 60 C 16.658 20 0 99 999.000 00 0.003 74 0.193 40 0.006 60 0.309 60 D 16.798 83 0.010 55 591.875 00 0.003 58 0.253 00 0.006 87 0.331 00 E 16.490 23 0 44.091 80 0.006 30 0.709 00 0.004 24 0.995 80 F 17.150 39 0 89.062 50 0.004 37 0.450 20 0.008 71 0.368 20 合计 total 14.600 00 0 216.875 00 0.008 32 0.130 40 0.001 73 0.961 60 ![]() 图 4 扁舵鲣Dloop区序列单倍型核苷酸不配对分布曲线observed:观测值;expected-sudden:sudden expansion model期望值;expected-spatial:spatial expansion model期望值Figure 4. Mismatch distribution of Dloop haplotypes for A.thazardThe observed pairwise differences are shown in bars and the expected values under the sudden expansion model and the spatial expansion model are in dash line and solid line, respectively.表 5 扁舵鲣Dloop区序列的Tajima′s D和Fu′s FS统计值及相应P值Table 5. Tajima′s D, Fu′s FS statistics, corresponding P values for A.thazard based on D-loop sequence
图 4 扁舵鲣Dloop区序列单倍型核苷酸不配对分布曲线observed:观测值;expected-sudden:sudden expansion model期望值;expected-spatial:spatial expansion model期望值Figure 4. Mismatch distribution of Dloop haplotypes for A.thazardThe observed pairwise differences are shown in bars and the expected values under the sudden expansion model and the spatial expansion model are in dash line and solid line, respectively.表 5 扁舵鲣Dloop区序列的Tajima′s D和Fu′s FS统计值及相应P值Table 5. Tajima′s D, Fu′s FS statistics, corresponding P values for A.thazard based on D-loop sequenceTajima′s D Fu′s FS D P FS P A -1.197 64 0.105 6 -22.371 26 0.000 0 B -0.824 10 0.217 0 -9.858 08 0.001 6 C -1.311 83 0.074 6 -22.879 46 0.000 0 D -1.091 56 0.134 6 -22.13015 0.000 0 E -1.214 73 0.104 2 -9.810 33 0.001 2 F -1.270 64 0.076 6 -21.295 23 0.000 0 合计 total -1.506 08 0.032 2 -23.812 49 0.001 4 ![]() 图 5 基于Dloop区序列的扁舵鲣总体样本的Bayesian Skyline Plots曲线黑色粗线代表有效种群大小的中间值,灰色细线范围代表 95%的置信区间Figure 5. Bayesian skyline plots of historical demography for A.thazard based on Dloop sequencesThe black bold line represents the median value of the effective population size and the grey thin lines represent the 95% credible intervals.
图 5 基于Dloop区序列的扁舵鲣总体样本的Bayesian Skyline Plots曲线黑色粗线代表有效种群大小的中间值,灰色细线范围代表 95%的置信区间Figure 5. Bayesian skyline plots of historical demography for A.thazard based on Dloop sequencesThe black bold line represents the median value of the effective population size and the grey thin lines represent the 95% credible intervals.3. 讨论
遗传多样性是生物多样性形成的基础和物种进化潜能的保证。鱼类遗传多样性的下降可降低其对环境的适应力并导致物种退化[10]。因此在渔业资源开发利用中,其遗传多样性水平的监测是不可忽视的部分。该研究检测到南海海域的扁舵鲣具有很高的单倍型多样性(h:0.999 5~1.000 0)和较高的核苷酸多样性(π:0.019~0.020),遗传多样性水平与同样基于Dloop区序列分析的苏禄海-西里伯斯海[17](h:0.972 0~1.000 0;π:0.031~0.036)和印度洋沿海[18](h:0.989 0~1.000 0;π:0.027~0.091)的扁舵鲣相当, 表明南海海域扁舵鲣种质资源良好,具备较高的进化潜力和对环境的适应能力。
根据GRANT和BOWEN[38]提出的h和π高低的4种组合模式,具有高的h和π的海洋生物种群可能是由原本就有分化的异域分布类群经过再次接触、产生基因交流而形成,或者是一个在长期的进化历史中有效种群大而且稳定的种群。中性检验和核苷酸不配对分布均表明南海扁舵鲣历史上曾经历过种群的扩张,并非一个稳定种群。Bayesian Skyline Plot分析显示其种群扩张时间约在更新世晚期(6万年之前),之后则趋于稳定直至现在。
因此,由历史上原来具有分化的类群的再次混合可能更好地解释南海扁舵鲣高h和π的遗传多样性模式。第四纪晚期的冰期-间冰期交替的气候,导致海平面反复升降[39],影响海洋生物的分布和种群波动。在更新世冰期,海平面的下降使得南海变成一个封闭的内陆海,仅通过巴士海峡与太平洋相通[40]。扁舵鲣现今的一些栖息地不复存在,分布范围缩小,同时可能与周边海域如太平洋和印度洋的群体产生隔离,形成相互分化的类群。之后的间冰期气候转暖,海平面上升,扁舵鲣可能在较大的范围发生扩散和重新殖化,完成种群的扩张;同时边缘海之间的路桥阻隔消失,被隔离的群体间重新接触从而产生基因交流。
渔业资源开发和管理的基本单位是基因上的个体同质组,即种群。许多渔业资源保护和再开发的成功都得益于对种群的判定和管理单元的合理划分[41-42]。该研究中南海扁舵鲣的系统发育分析并未发现有遗传分化的地理聚群,AMOVA和成对FST分析也表明南海海域内扁舵鲣遗传同质性很强,是一个随机交配的单一种群(unit population)。这种遗传结构模式属于AVISE[43]总结的系统地理格局的第四种即“系统发育上连续的类群,在空间分布上也连续”模式,也即LAIKRE[10]定义的“无变异种群”,在开发和管理政策的制定上可视为一个管理单元(management units,MUs)。
海洋环境的开放性和海洋生物较强的扩散力被认为是导致海洋生物在较大的范围内表现出很低的遗传分化的原因[38, 44-45]。由于缺乏一般的物理屏障,海洋中许多生物的浮游性卵和幼体可以借助洋流扩散,这可能导致距离很远的群体间产生基因交流。扁舵鲣具有较强的游泳能力和长距离洄游习性,其在南海的产卵场也基本遍布南海北部近海和中沙、西沙和南沙等岛礁水域[46-47],南海不同季节由季风主导的海洋环流、夏季季风漂流形成的水平环流[48]以及部分海域的上升流等可以促使卵和仔稚鱼的扩散,使得其在南海这个大的无阻隔水体中较容易产生交流形成基因均质化,成为一个随机交配的种群。
尽管南海海域有扁舵鲣产卵场存在的证据,该研究也支持南海扁舵鲣为一个单一种群的结论,但并不能确定南海的扁舵鲣是否都为本地种群。南海作为西北太平洋的边缘海,周边的大陆和岛屿将其与太平洋和印度洋隔离,成为一个半封闭半开放型水体。扁舵鲣作为广泛分布的大洋性物种,移动性很强,南海半开放型水体使得其种群很有可能与周边海域的种群存在基因交流。因此,今后需要通过与其他海域样本同源序列标记的联合分析,以及结合物理标签放流实验来对南海扁舵鲣作进一步的种群识别研究。
-
![]()
图 2 基于邻接法构建的扁舵鲣Dloop区单倍型系统发育树
每一枝的末端代表来自不同采样点的样本;
各分支标记大于50%的自展值Figure 2. Neighbour-joining tree for Dloop haplotypes of A.thazard
The tails of branches represent samples from different populations.
Bootstrap supports of >50% are shown at nodes.![]()
图 3 基于邻接网络法构建的扁舵鲣Dloop区序列进化网
每一枝的末端代表一个个体,样本名省略
Figure 3. Neighbor-net constructed from Dloop sequences of A.thazard
The tail of every branch represents one individual. (sample ID were omitted)
![]()
图 4 扁舵鲣Dloop区序列单倍型核苷酸不配对分布曲线
observed:观测值;expected-sudden:sudden expansion model期望值;expected-spatial:spatial expansion model期望值
Figure 4. Mismatch distribution of Dloop haplotypes for A.thazard
The observed pairwise differences are shown in bars and the expected values under the sudden expansion model and the spatial expansion model are in dash line and solid line, respectively.
![]()
图 5 基于Dloop区序列的扁舵鲣总体样本的Bayesian Skyline Plots曲线
黑色粗线代表有效种群大小的中间值,灰色细线范围代表 95%的置信区间
Figure 5. Bayesian skyline plots of historical demography for A.thazard based on Dloop sequences
The black bold line represents the median value of the effective population size and the grey thin lines represent the 95% credible intervals.
表 1 南海扁舵鲣样本信息及遗传多样性统计数据
Table 1 Sampling information and descriptive statistics of genetic diversity of A.thazard
采样点
sampling site经度/纬度
longitude/latitude采样时间
date of sampling样本量(N)
number of samples单倍型数量(H)
number of haplotypes多态性位点数
(S)number of polymorphic sites单倍型多样性
(h±SD)haplotype diversity核苷酸多样性(π±SD)
nucleotide diversityA 108°03′E /18°12′N 2014-11-22 35 35 103 1.000 0±0.006 8 0.019 873±0.010 042 B 112°03′E /20°14′N 2014-11-28 27 25 74 0.994 3±0.011 9 0.017 537±0.008 989 C 116°03′E /18°25′N 2015-03-20 35 35 104 1.000 0±0.006 8 0.019 057±0.009 646 D 117°28′E /15°04′N 2013-04-05 35 35 101 1.000 0±0.006 8 0.020 306±0.010 252 E 112°23′E /13°30′N 2014-08-05 24 23 81 0.996 4±0.013 3 0.017 471±0.009 002 F 114°12′E /10°17′N 2014-05-20 34 34 106 1.000 0±0.007 1 0.020 069±0.010 147 G 112°46′E /17°48′N 2014-04-24 3 3 23 1.000 0±0.272 2 0.017 762±0.013 721 H 112°56′E / 7°34′N 2013-03-22 7 7 38 1.000 0±0.076 4 0.016 746±0.009 783 总计 total - - 200 191 184 0.999 5±0.000 6 0.019 133±0.009 447  下载: 导出CSV
表 2 扁舵鲣地理群体遗传变异的分子方差分析
Table 2 Analysis of molecular variance for populations of A.thazard
变异来源
source of variation自由度
degree of freedom变异百分比
percentage of variation分化系数
F statisticsP 群体间among populations 5 0.27 FST= 0.002 7 0.218 9 群体内within populations 184 99.73 所有样本total 189
下载: 导出CSV
表 3 扁舵鲣两两地理群体间的遗传分化系数(对角线下方)及随机交配假设检验的显著性水平(对角线上方)
Table 3 Pairwise FST (below diagonal) and non-differentiation exact P values (above diagonal) among geographic populations of A.thazard
采样点
sampling siteA B C D E F A 0.513 35 1.000 00 1.000 00 0.729 45 1.000 00 B -0.003 00 0.209 60 0.220 20 0.315 55 0.460 45 C 0.006 32 0.014 17 1.000 00 0.507 40 1.000 00 D -0.001 58 0.006 53 0.001 62 0.475 20 1.000 00 E 0.009 37 0.001 87 0.010 16 0.013 13 1.000 00 F -0.004 54 0.000 44 -0.001 38 -0.006 31 0.003 31
下载: 导出CSV
表 4 扁舵鲣Dloop区序列核苷酸不配对分布分析的参数估计值
Table 4 Mismatch distribution parameter estimates for A.thazard based on D-loop sequence
核苷酸不配对分布mismatch distribution 吻合度检验goodness-of-fit test 扩张时间
τ初始值
θ0最终值
θ1平方和
SSDP 粗糙指数
HRIP A 17.761 72 0 88.906 25 0.002 40 0.785 80 0.003 97 0.917 80 B 17.367 19 0 98.046 88 0.004 39 0.557 00 0.006 96 0.741 60 C 16.658 20 0 99 999.000 00 0.003 74 0.193 40 0.006 60 0.309 60 D 16.798 83 0.010 55 591.875 00 0.003 58 0.253 00 0.006 87 0.331 00 E 16.490 23 0 44.091 80 0.006 30 0.709 00 0.004 24 0.995 80 F 17.150 39 0 89.062 50 0.004 37 0.450 20 0.008 71 0.368 20 合计 total 14.600 00 0 216.875 00 0.008 32 0.130 40 0.001 73 0.961 60
下载: 导出CSV
表 5 扁舵鲣Dloop区序列的Tajima′s D和Fu′s FS统计值及相应P值
Table 5 Tajima′s D, Fu′s FS statistics, corresponding P values for A.thazard based on D-loop sequence
Tajima′s D Fu′s FS D P FS P A -1.197 64 0.105 6 -22.371 26 0.000 0 B -0.824 10 0.217 0 -9.858 08 0.001 6 C -1.311 83 0.074 6 -22.879 46 0.000 0 D -1.091 56 0.134 6 -22.13015 0.000 0 E -1.214 73 0.104 2 -9.810 33 0.001 2 F -1.270 64 0.076 6 -21.295 23 0.000 0 合计 total -1.506 08 0.032 2 -23.812 49 0.001 4
下载: 导出CSV
-
[1] COLLETTE B B, AADLAND C R. Revision of the frigate tunas (Scombridae, Auxis), with descriptions of two new subspecies from the eastern Pacific[J]. Fish Bull, 1996, 94(3): 423-441.
[2] FROESE R, PAULY D. FishBase[DB/OL]. [2015-04-21]. http://www.fishbase.org/summary/Auxis-thazard.html.
[3] FAO. Global production statistics 1950-2013, Frigate tuna[R]. Rome: FAO, 2015.
[4] 晏磊, 张鹏, 杨吝, 等. 2011年春季南海中南部海域灯光罩网渔业渔获组成的初步分析[J]. 南方水产科学, 2014, 10(3): 97-103. doi: 10.3969/j.issn.2095-0780.2014.03.015 [5] 张鹏, 曾晓光, 杨吝, 等. 南海区大型灯光罩网渔场渔期和渔获组成分析[J]. 南方水产科学, 2013, 9(3): 74-79. doi: 10.3969/j.issn.2095-0780.2013.03.012 [6] 刘维, 张羽翔, 陈积明, 等. 南沙群岛春季灯光围网渔业资源调查初步分析[J]. 上海海洋大学学报, 2012, 21(1): 105-109. https://www.shhydxxb.com/shhy/article/abstract/201101163 [7] 颜云榕, 冯波, 卢伙胜. 中、西沙海域2种灯光作业渔船的捕捞特性及其技术效率分析[J]. 南方水产, 2009, 5(6): 59-64. doi: 10.3969/j.issn.1673-2227.2009.06.011 [8] 杨吝, 张旭丰, 谭永光, 等. 南海北部灯光围网渔获组成分析[J]. 南方水产, 2009, 5(6): 65-70. doi: 10.3969/j.issn.1673-2227.2009.06.012 [9] MCHICH R, CHAROUKI N, AUGER P, et al. Optimal spatial distribution of the fishing effort in a multi fishing zone model[J]. Ecol Model, 2006, 197(3): 274-280. https://www.semanticscholar.org/paper/Optimal-spatial-distribution-of-the-fishing-effort-Mchich-Charouki/54e98133b7ca0bf51fecbeb4b2600b5375d71f37
[10] LAIKRE L, PALM S, RYMAN N. Genetic population structure of fishes: implications for coastal zone management[J]. Ambio, 2005, 34(2): 111-119. doi: 10.1579/0044-7447-34.2.111
[11] 季维智, 宿兵. 遗传多样性研究的原理与方法[M]. 杭州: 浙江科学技术出版社, 1999: 5-78. http://ir.kib.ac.cn/handle/151853/17240 [12] 赵传絪, 陈莲芳, 臧增嘉. 东海舵鲣的早期发育和生殖习性[J]. 水产学报, 1982, 6(3): 253-266. http://scxuebao.ijournals.cn/scxuebao/article/abstract/19820307 [13] 卢振彬, 戴泉水, 颜尤明. 台湾海峡及其邻近海区扁舵鲣的生长与死亡[J]. 水产学报, 1991, 15(3): 228-235. http://scxuebao.ijournals.cn/scxuebao/article/abstract/19910307?st=search [14] YU T, CHEN M, DU J, et al. Age and growth changes and population dynamics of the black pomfret (Parastromateus niger) and the frigate tuna (Auxis thazard thazard) in the Taiwan Strait[J]. Lat Am J Aquat Res, 2012, 40(3): 649-656. doi: 10.3856/vol40-issue3-fulltext-13
[15] 卢振彬, 颜尤明, 戴泉水. 闽中、闽东渔场扁舵鲣的资源生物学[J]. 台湾海峡, 1992, 11(3): 251-256. https://xueshu.baidu.com/usercenter/paper/show?paperid=1138965dc1744661fc3c7d8972f741ed&site=xueshu_se&hitarticle=1 [16] JUDE D, NEETHISELVAN N, GOPALAKRISHNAN P, et al. Gill net selectivity studies for fishing frigate tuna, Auxis thazard Lacepede (Perciformes: Scombridae) in Thoothukkudi waters, southeast coast of India[J]. Ind J Mar Sci, 2002, 31(4): 329-333.
[17] IVANE R P, ALTAIR B A, MUDJEKEEWIS D S. Genetic diversity, population genetic structure, and demographichistory of Auxis thazard (Perciformes), Selar crumenophthalmus (Perciformes), Rastrelliger kanagurta (Perciformes) and Sardinella lemuru (Clupeiformes) in Sulu-Celebes Sea inferred by mitochondrial DNA sequences[J]. Fish Res, 2015, 162: 64-74. doi: 10.1016/j.fishres.2014.10.006
[18] KUMAR G, KUNAL S P, MENEZES M R, et al. Three genetic stocks of frigate tuna Auxis thazard thazard (Lacepede, 1800) along the Indian coast revealed from sequence analyses of mitochondrial DNA D-loop region[J]. Mar Biol Res, 2012, 8(10): 992-1002. https://xueshu.baidu.com/usercenter/paper/show?paperid=1k0708j09v7j0es0x77t02d0kx525719&site=xueshu_se&hitarticle=1
[19] KUMAR G, KUNAL S P, MENEZES M R. Genetic stock structure of frigate tuna (Auxis thazard) along Indian coast based on PCR-RFLP analyses of mtDNA D-loop region [J]. Turk J Fish Aquat Sci, 2012, 12: 893-903. https://www.researchgate.net/publication/234117334_Genetic_Stock_Structure_of_Frigate_Tuna_Auxis_thazard_Along_Indian_Coast_Based_on_PCR-RFLP_Analyses_of_mtDNA_D-Loop_Region
[20] HALL T A. BioEdit: a user-friendly biological sequence alignment editor and analysis program for Windows 95/98/NT [J]. Nucl Acids Symp, 1999, 41: 95-98. doi: 10.1021/bk-1999-0734.ch008
[21] TAMURA K, STECHER G, PETERSON D, et al. MEGA 6: molecular evolutionary genetics analysis version 6.0[J]. Mol Biol Evol, 2013, 30(12): 2725-2729. doi: 10.1093/molbev/mst197
[22] LIBRADO P, ROZAS J. DnaSP v5: a software for comprehensive analysis of DNA polymorphism data [J]. Bioinformatics, 2009, 25(11): 1451-1452. doi: 10.1093/bioinformatics/btp187
[23] EXCOFFIER L, LISCHER H L. Arlequin suite ver 3.5: a new series of programs to perform population genetics analyses under Linux and Windows [J]. Mol Ecol Resour, 2010, 10(3): 564-567.
[24] POSADA D, CRANDALL K A. Intraspecific gene genealogies: trees grafting into networks[J]. Trends Ecol Evol, 2001, 16(1): 37-45. doi: 10.1016/s0169-5347(00)02026-7
[25] HUSON D H, BRYANT D. Application of phylogenetic networks in evolutionary studies[J]. Mol Biol Evol, 2006, 23(2), 254-267. doi: 10.1093/molbev/msj030
[26] EXCOFFIER L, SMOUSE P E, QUATTRO J M. Analysis of molecular variance inferred from metric distances among DNA haplotypes: application to human mitochondrial DNA restriction data[J]. Genetics, 1992, 131(2): 479-491.
[27] EXCOFFIER L. Patterns of DNA sequence diversity and genetic structure after a range expansion: lessons from the infinite-island model[J]. Mol Ecol, 2004, 13(4): 853-864. doi: 10.1046/j.1365-294x.2003.02004.x
[28] RAY N, CURRAT M, EXCOFFIER L. Intra-Deme molecular diversity in spatially expanding populations[J]. Mol Biol Evol, 2003, 20(1): 76-86. doi: 10.1093/molbev/msg009
[29] HARPENDING H C. Signature of ancient population growth in a low-resolution mitochondrial DNA mismatch distribution[J]. Hum Biol, 1994, 66(4): 591-600.
[30] RAMOS-ONSINS S E, ROZAS J. Statistical properties of new neutrality tests against population growth[J]. Mol Biol Evol, 2002, 19(12): 2092-2100. doi: 10.1093/oxfordjournals.molbev.a004034
[31] TAJIMA F. Statistical-method for testing the neutral mutation hypothesis by DNA polymorphism[J]. Genetics, 1989, 123(3): 585-595. doi: 10.1093/genetics/123.3.585
[32] FU Y X. Statistical tests of neutrality of mutations against population growth, hitchhiking and background selection[J]. Genetics, 1997, 147(2): 915-925. doi: 10.1093/genetics/147.2.915
[33] DRUMMOND A J, RAMBAUT A. BEAST v1.4[EB/OL]. [2015-02-15]. http://beast.bio.ed.ac.uk.
[34] DRUMMOND A J, RAMBAUT A, SHAPIRO B, et al. Bayesian coalescent inference of past population dynamics from molecular sequences[J]. Mol Biol Evol, 2005, 22(5): 1185-1192. doi: 10.1093/molbev/msi103
[35] DRUMMOND A J, SUCHARD M, XIE D, et al. Bayesian phyloge-netics with BEAUti and the BEAST 1.7[J]. Mol Biol Evol, 2012, 29(8): 1969-1973. doi: 10.1093/molbev/mss075
[36] DONALDSON K A, WILSON R R. Amphi-Panamaic geminates of snook (Percoidei: Centropomidae) provide a calibration of the divergence rates in the mitochon-drial DNA control region of fishes[J]. Mol Phylogenet Evol, 1999, 13(1): 208-213. doi: 10.1006/mpev.1999.0625
[37] RAMBAUT A, DRUMMOND A J. Tracer v1.5[EB/OL]. [2015-03-06]. http://tree.bio.ed.ac.uk/software/tracer.
[38] GRANT W S, BOWEN BW. Shallow population histories in deep evolutionary lineages of marine fishes: insights from sardines and anchovies and lessons for conservation[J]. J Hered, 1998, 89(5): 415-426. doi: 10.1093/jhered/89.5.415
[39] IMBRIE J, BOYLE E A, CLEMENS S C, et al. On the structure and origin of major glaciation cycles, 1. Linear responses to Milankovitch forcing[J]. Paleoceanography, 1992, 7(6): 701-738.
[40] WANG P. Response of western Pacific marginal seas to glacial cycles: paleoceanographic and sedimentological features[J]. Mar Geol, 1999, 156(1): 5-39.
[41] BURRIDGE C P, JOHN R G. Conservation genetic studies of the endangered cape fear shiner, Notropis mekistocholas (Teleostei: Cyprinidae) [J]. Conserv Genet, 2003, 4(2): 219-225.
[42] MCCUSKER M R, MANDRAK N E, EGEH B, et al. Population structure and conservation genetic assessment of the endangered Pugnose Shiner, Notropis anogenus[J]. Conserv Genet, 2014, 15(2): 343-353.
[43] AVISE J C. Phylogeography: the history and formation of species[M]. Cambridge: Harvard University Press, 2000: 1-464. doi: 10.2307/j.ctv1nzfgj7
[44] HEWITT G M. The genetic legacy of the Quaternary ice ages[J]. Nature, 2000, 405(6789): 907-913. doi: 10.1038/35016000
[45] PALUMBI S R. Genetic divergence, reproductive isolation, and marine speciation[J]. Annu Rev Ecol Syst, 1994, 25: 547-572. doi: 10.1146/annurev.es.25.110194.002555
[46] 张仁斋. 三种金枪鱼类(鲣、黄鳍金枪鱼、扁舵鲣)的仔、稚鱼在南海的分布和产卵[J]. 海洋学报, 1983, 5(3): 368-375. http://www.hyxb.org.cn/aos/ch/reader/view_abstract.aspx?file_no=19830311 [47] 陈真然, 魏淑珍. 南海中部海域金枪鱼类仔稚鱼的分布[J]. 水产学报, 1981, 4(1): 41-47. http://scxuebao.ijournals.cn/scxuebao/article/abstract/19810104?st=search [48] 苏纪兰. 中国近海水文[M]. 北京: 海洋出版社, 2005: 1-367. doi: 10.3321/j.issn:0253-4193.2001.04.001 -
期刊类型引用(4)
1. 陈淑吟, 张志勇, 吉红九, 李鹏, 赵永超, 张志伟. 黑鲷×真鲷杂交子代与真鲷的Calmodulin基因克隆与表达分析. 海洋渔业. 2018(04): 435-446 .  百度学术
百度学术
2. 邬晓勇, 孙雁霞, 梁勇, 陈月星, 苟小军. 基于CODEHOP的欧李钙调蛋白基因片段的克隆. 烟台大学学报(自然科学与工程版). 2017(04): 292-300 . 百度学术
3. 陈淑吟, 李鹏, 张志勇, 许津, 祝斐, 贾超峰, 王思婷, 任忠宏. 黑鲷♀×真鲷♂反交子代与黑鲷的CaM基因克隆与mRNA表达分析. 中国水产科学. 2017(06): 1193-1202 . 百度学术
4. 李彦, 李北平, 蔡永琴, 岳俊杰, 邱正良. 用高斯网络模型研究钙调蛋白的构象转变. 生物技术通讯. 2016(06): 799-803 . 百度学术
其他类型引用(1)
计量
- 文章访问数: 2995
- HTML全文浏览量: 156
- PDF下载量: 728
- 被引次数: 5
 粤公网安备 44010502001741号
