
Seasonal variability in mixed layer depth in Nansha area in 2013
-
摘要:
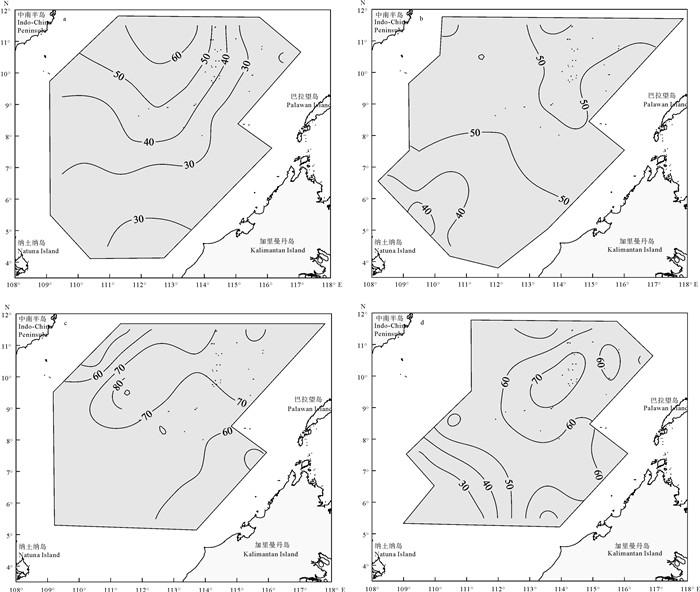
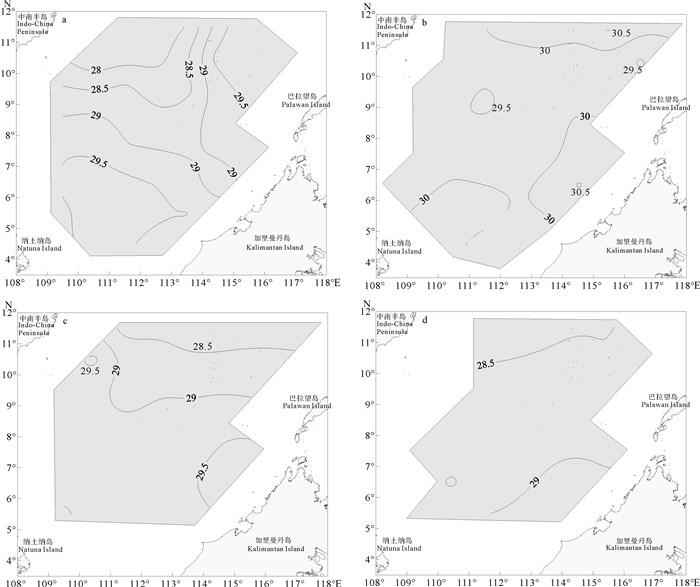
基于2013年在南沙海域开展的4个航次生态环境综合调查的实测资料,研究了该海域混合层深度(MLD)的季节变化特征。结果表明,南海南部海域MLD季节变化明显,海域均值以秋季最深(65 m),冬季次之(54 m),夏季居第3位(49 m),春季最浅(37 m),主要受季风、环流和海面净热通量的影响。其中春季时中南半岛对开的海域MLD较深,夏季时整个海域MLD分布较均匀,秋季时海域中部MLD最深,冬季时高值区出现在海域东北部。Ekman输运导致水体在巴拉望岛西侧、南沙南部以及加里曼丹岛西北侧产生的堆积作用,以及9°N以北海域冬季存在的失热效应,是MLD存在区域差异的可能原因。南海南部海域混合层水温始终大于27 ℃,其中夏季大于28 ℃,混合层内水温的季节变化很小。海表温度(SST)区域差异大时,MLD空间差异亦大;MLD与SST的关系在调查海域的南部和北部存在差异,代表性站位的研究结果显示,海域北部MLD与SST的变化刚好相反,而海域南部由于靠近赤道太阳辐射全年变化小致使SST变化亦小,SST与自春向冬急速加深的MLD关系不明显。
Abstract:Based on the observed data during four comprehensive investigations on ecological environment of Nansha area in 2013,we investigated the seasonal variability in mixed layer depth (MLD) in that area. Significant seasonal variability in MLD in that area was observed. In autumn,the MLD reached its maximum (65 m),followed by winter (54 m),summer (49 m) and spring (37 m). These seasonal variabilities were closely related with variations in monsoon,ocean current and sea surface heat flux. The MLD in the southeast area to the Indo-China Peninsula was deeper in spring;the MLD distribution was uniform in summer;the deepest MLD appeared in the central area in autumn;high value appeared in the northeastern area in winter. Ekman transport led to the effects of accumulation of water in the west Palawan Island,the south Nansha area and northwest Kalimantan Island,as well as heat lost effect on north of 9°N area in winter,which might be the reason for regional difference of MLD. Moreover,the water temperature of mixed layer in that area was always over 27 ℃ (more than 28 ℃ in summer),and seasonal change of water temperature in the mixed layer was very little. When the regional difference of sea surface temperature (SST) was huge,so was the space difference of MLD. Difference was found in relationship between MLD and SST between north and south in the surveyed area. Representative stations results reveal that MLD was contrary to the change of SST in the northern area,while in the southern area,the relationship between SST and MLD was not obvious. Since the southern area is near the equator,the change of solar radiation was little throughout the year which led to the little SST change. MLD rapidly deepened from spring to winter,which was not obviously related with SST.
-
Keywords:
- Nansha area /
- mixed layer depth /
- seasonal variability /
- water temperature
-
华贵栉孔扇贝(Chlamys nobilis)属于热带海水贝类,具有肉质鲜美、营养价值高等优点,自20世纪70年代起,有关其人工育苗和规模化养殖迅速在南方各沿海省份展开,并取得了较好的经济效益,但由于长期养殖,华贵栉孔扇贝也面临种质质量退化的问题,严重影响了该产业的健康发展。目前相关机构已经对其开展了选育研究,并取得了初步成效。数量遗传学作为一种新型研究遗传育种的学科,在水产动物遗传育种中展现了很大的优越性,但将此方法运用于华贵栉孔扇贝良种选育的相关研究尚不多见。该研究在此方向作了初步探索,解决华贵栉孔扇贝养殖产业健康发展的关键所在是建立有效的良种选育方法[3-4]。
三亚崖州湾海区是海南省华贵栉孔扇贝主养区之一,已有5年养殖经历。笔者通过对该海区养殖的华贵栉孔扇贝数量性状的测量和分析,采用多元分析和回归方法,建立形态性状与质量性状间的多元线性回归方程[5],以期为华贵栉孔扇贝通过数量性状辅助选择育种提供相关理论依据。
1. 材料与方法
1.1 材料
受测的华贵栉孔扇贝来自于三亚崖州湾养殖海区,由三亚意源养殖有限公司提供。
1.2 取样和测量方法
2010年3月30日一次性随机选取各年龄阶段526个扇贝标本测量其数量性状。测量前清除其表面附着物。5个形态性状(壳高、壳长、绞合线长、壳厚和贝柱直径)用数显游标卡尺测量(精度为0.02 mm),6个质量性状(总质量、壳质量、贝柱鲜质量、鲜肉质量、干肉质量和贝柱干质量)用电子天平测量(精度为0.01 g)。鲜肉质量指活体去壳后含水分的质量,干肉质量指将鲜肉放入烘箱去除水分后的质量。
1.3 数据分析方法
测量的数据使用SPSS 13软件进行数据分析,对数据采用t检验,用多元回归分析法,分析5个测量指标[壳高(x1)、壳长(x2)、绞合线长(x3)、壳厚(x4)和总质量(x5)]对扇贝3个经济性状[鲜肉质量(y1)、肉柱鲜质量(y2)和肉柱干质量(y3)]的影响,同时作通径分析。
2. 结果与分析
2.1 各性状的参数分析
华贵栉孔扇贝壳高、壳长、绞合线长、壳厚、贝柱直径、总质量、壳质量、鲜肉质量、贝柱鲜质量、干肉质量和贝柱干质量等11个数量性状的各种参数见表 1。其中不同性状的参数单位有所不同,不能进行性状间比较。变异系数的单位相同,因而可以进行性状间比较。性状的变异系数越大,表明品种相应指标可供选择的范围越大,选择的潜力就越大。11个性状的变异系数由大到小依次为贝柱干质量>干肉质量>贝柱鲜质量>鲜肉质量>总质量>壳质量>贝柱直径>壳厚>绞合线长>壳长>壳高。因此,在华贵栉孔扇贝高产品种培育中对这些性状进行选择时,应首先考虑贝柱干质量,其次是干肉质量、贝柱鲜质量、鲜肉质量、总质量、壳质量、贝柱直径、壳厚、绞合线长和壳长,最后是壳宽。
表 1 各性状的表型统计量(n=526)Table 1. Phenotypic statistics of various quantitative traits参数parameter 壳高/mm SH 壳长/mm SL 绞合线长/mm HL 壳厚/mm ST 贝柱直径/mm CP 总质量/g TW 壳质量/g WWAM 鲜肉质量/g FW 贝柱鲜质量/g CFW 干肉质量/g DFW 贝柱干质量/g DWAM max 76.00 72.30 42.00 26.30 23.10 54.01 29.93 24.74 5.32 3.66 1.30 min 44.10 41.00 21.90 13.10 8.90 10.23 7.28 1.33 0.55 0.40 0.07 mean 60.52 55.57 32.58 18.97 15.83 27.86 17.07 10.79 2.40 1.46 0.53 R 31.90 31.30 20.10 13.20 14.20 43.78 22.65 23.41 4.77 3.26 1.23 SD 5.52 5.44 3.32 2.04 2.46 7.08 4.17 3.29 0.87 0.57 0.22 SE 0.24 0.24 0.14 0.09 0.11 0.31 0.18 0.14 0.04 0.02 0.01 CV 9.12% 9.80% 10.19% 10.77% 15.56% 25.43% 24.42% 30.51% 36.31% 38.99% 42.19% 2.2 5个数量性状的回归分析及通径分析
2.2.1 鲜肉质量
分析5个测量指标[壳高(x1)、壳长(x2)、绞合线长(x3)、壳厚(x4)和总质量(x5)]对扇贝鲜肉质量(y)的影响(表 2)。总质量与鲜肉质量为极显著的正相关(相关系数为0.839 4,P < 0.01),壳厚与贝柱鲜质量为显著的负相关(相关系数为-0.110 7,0.01 < P < 0.05)。y=1.295-0.033 15x1-0.091 6x4+0.474 9x5,决定系数R2=0.878 563,剩余标准差SSE=1.150 2。
表 2 5个数量性状对鲜肉质量的逐步回归分析Table 2. Stepwise regression analysis between 5 quantitative traits and shell-free weight变量variable 回归系数regression coefficient 标准回归系数standard regression coefficient 偏相关partial correlation t P x1 -0.033 1 -0.055 5 -0.092 8 2.126 9 0.033 9 x4 -0.091 6 -0.056 8 -0.107 4 2.464 6 0.014 0 x5 0.474 9 1.022 5 0.839 4 35.246 5 0.000 0 通径系数反映自变量对依变量的直接影响,总质量对鲜肉质量的影响最为明显,直接系数为1.024 9(表 3)。x5与鲜肉质量的相关系数最大,而x1和x4与鲜肉质量呈负相关,x5与鲜肉质量呈正相关。
表 3 5个数量性状对鲜肉质量的通径分析Table 3. Path analysis between 5 quantitative traits and shell-free weight变量variable 直接系数direct factor 通过x1 by x1 通过x4 by x4 通过x5 by x5 总影响total impact x1 -0.055 5 - -0.037 8 0.822 6 0.729 3 x4 -0.056 8 -0.036 9 - 0.757 1 0.663 4 x5 1.024 9 -0.044 7 -0.042 1 - 0.935 7 2.2.2 贝柱鲜质量
分析5个测量指标[壳高(x1)、壳长(x2)、绞合线长(x3)、壳厚(x4)和总质量(x5)]对扇贝贝柱鲜质量(y)的影响(表 4),总质量与贝柱鲜质量呈极显著的正相关(相关系数为0.622 9,P < 0.01),绞合线长与贝柱鲜质量呈极显著的负相关(相关系数为-0.196 6,P < 0.01)。y=-0.168 8+0.027 34x2-0.046 04x3+0.091 4x5,决定系数R2=0.617 847,剩余标准差SSE=0.539 5。
表 4 5个数量性状对贝柱鲜质量的逐步回归分析Table 4. Stepwise regression analysis between 5 quantitative traits and adductor muscle weight变量variable 回归系数regression coefficient 标准回归系数standard regression coefficient 偏相关partial correlation t P x2 0.027 3 0.171 0 0.154 5 3.569 8 0.000 4 x3 -0.046 0 -0.175 7 -0.196 6 4.576 6 0.000 0 x5 0.091 4 0.744 1 0.629 9 18.513 1 0.000 0 从表 5中可以看出,通径系数反映自变量对依变量的直接影响。结果显示,总质量对贝柱鲜质量的影响最为明显,直接系数为0.744 1;x2和x5与贝柱鲜质量呈正相关,x3与贝柱鲜质量呈负相关; x5的总体影响最大(0.775 4),x2其次(0.596 0)。
表 5 5个数量性状对贝柱鲜质量的通径分析Table 5. Path analysis between 5 quantitative traits and adductor muscle weight变量variable 直接系数direct factor 通过x1 by x1 通过x4 by x4 通过x5 by x5 总影响total impact x2 0.171 0 - -0.124 4 0.549 5 0.596 0 x3 -0.175 7 0.121 1 - 0.402 1 0.347 5 x5 0.744 1 0.126 3 -0.094 9 - 0.775 4 2.2.3 贝柱干质量
分析5个测量指标[壳高(x1)、壳长(x2)、绞合线长(x3)、壳厚(x4)和总质量(x5)]对扇贝贝柱干质量(y)的影响(表 6)。总质量与贝柱干质量为极显著的正相关(相关系数为0.743 0,P < 0.01),壳长与贝柱干质量为显著的负相关(相关系数为-0.092 2,P < 0.05),绞合线长与贝柱干质量为极显著的负相关(相关系数为-0.141 1,P < 0.01)。y=0.228 7-0.005 0x2-0.007 8x3+0.029 9x5,决定系数R2=0.664 705,剩余标准差SSE=0.129 1。
表 6 5个数量性状对贝柱干质量的逐步回归分析Table 6. Stepwise regression analysis between 5 quantitative traits and adductor muscle dry weight变量variable 回归系数regression coefficient 标准回归系数standard regression coefficient 偏相关partial correlation t P x2 -0.005 0 -0.123 7 -0.119 9 2.756 7 0.006 0 x3 -0.007 8 -0.117 0 -0.141 1 3.253 9 0.001 2 x5 0.029 9 0.954 0 0.743 0 25.341 1 0.000 0 从表 7可以看出,通径系数反映自变量对依变量的直接影响。结果显示,总质量对贝柱鲜质量的影响最为明显,直接系数为0.954 0。
表 7 5个数量性状对贝柱干质量的通径分析Table 7. Path analysis between 5 quantitative traits and adductor muscle dry weight变量variable 直接系数direct factor 通过x1 by x1 通过x4 by x4 通过x5 by x5 总影响total impact x2 -0.123 7 - -0.082 9 0.704 5 0.497 9 x3 -0.117 0 -0.087 6 - 0.515 5 0.310 9 x5 0.954 0 -0.091 3 -0.063 2 - 0.799 4 x5与贝柱干质量呈正相关,x2和x3与贝柱干质量呈负相关,x5对贝柱干质量产生的影响最为明显。
3. 讨论
3.1 通径分析的运用
性状间的相关系数是进行多元分析的基础,但相关系数是两变量间关系的综合体现,其既包括变量间的直接关系,又包括通过其他变量影响的间接关系。单纯采用性状间的相关系数不能正确表述两性状间的真实关系。通径分析可用于分析多个自变量与变量之间的线性关系,是回归分析的拓展,不仅可以处理较为复杂的变量关系,而且能把性状间相关性分成直接影响和间接影响[6-8]。该研究中华贵栉孔扇贝壳高、壳长、绞合线长、壳厚和总质量与扇贝的鲜肉质量、贝柱鲜质量及贝柱干质量的相关系数均极显著,建立回归方程时将其余几个对经济性状相关系数影响不显著的予以剔除以建立理想的回归方程。
3.2 数量性状的选育
衡量华贵栉孔扇贝生长状况的数量性状一般包括长度(高度)和质量,该研究选取长度和质量2个性状来探讨华贵栉孔扇贝数量性状间的相关性。以相关形态性状和总质量为自变量,对3个主要经济性状的回归相关性极显著。把简单易测的性状作为自变量是符合期望的[9-11]。因此,在华贵栉孔扇贝的遗传育种中把壳长和总质量作为重要生长指标即可。通径分析在水产动物的遗传育种中运用非常广泛[12-16],如王爱民等[17]对马氏珠母贝(Pinctada martensii)不同地理种群内自繁和种群间杂交子一代形态性状参数进行了相关分析,郑怀平等[18]对近江牡蛎(Ostrea rivularis gould)养殖群体数量性状间的相关性进行了通径分析,喻子牛等[19]对香港巨牡蛎(Crassostrea hongkongensis)雌雄群体数量性状进行了通径分析。
3.3 选育对加工产业的意义
选育优质的良种对华贵栉孔扇贝加工产业具有相当重要的意义。加工企业需用扇贝的贝柱来加工产品,因而对贝柱的质量格外关注。该研究中对扇贝贝柱鲜质量和贝柱干质量均作了相关分析[20]与通径分析,研究结果显示,总质量对于3个经济性状的正面影响最大。因此,在高产选育时应选择总质量大的品种来进行选育,使获得的优良品种能够产生大的贝柱。
致谢: 农业部财政重大专项“南海渔业资源调查与评估”(NFZX2013)课题组成员在海上调查方面提供了大力的支持和帮助,谨此致谢! -
![]()
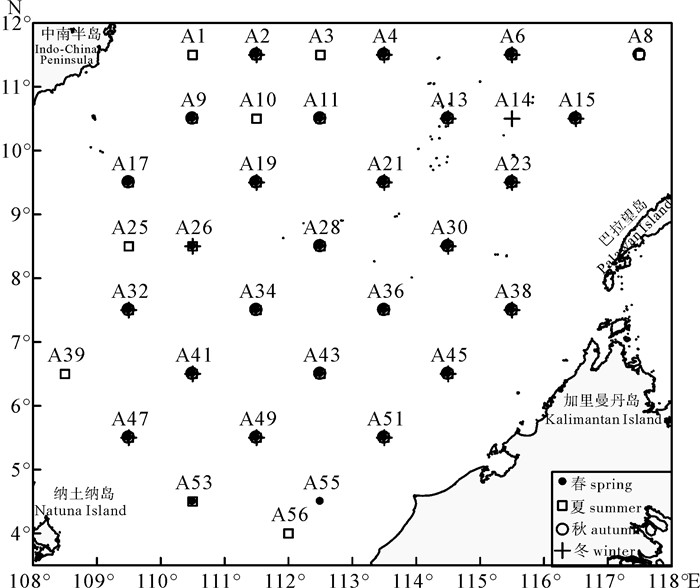
图 2 四季混合层深度平面分布图(m)(a、b、c、d分别为春、夏、秋、冬)
Figure 2. Spatial distribution of MLD in Nansha area in four seasons (m)(a,b,c,d are spring, summer,autumn and winter,respectively)
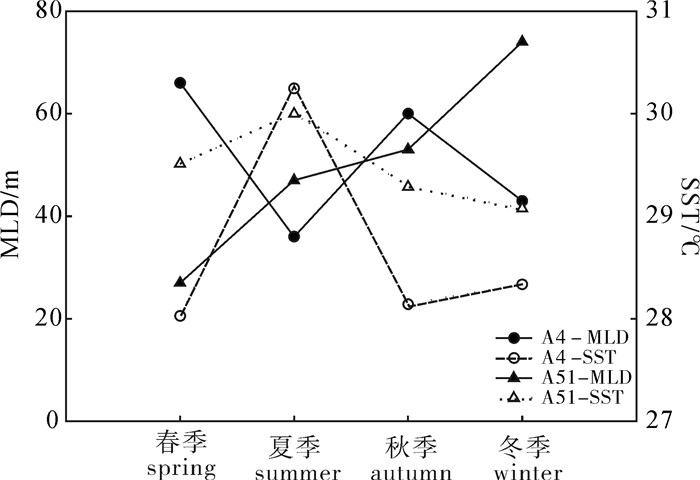
![]()
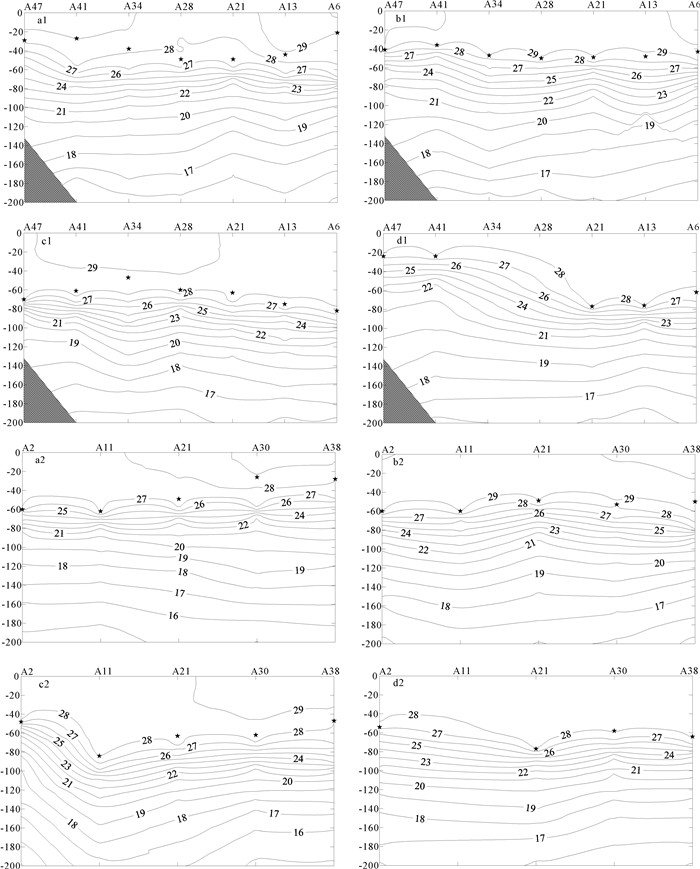
图 3 A47、A2断面四季混合层特征
a1/b1/c1/d1分别为A47断面的春/夏/秋/冬,a2/b2/c2/d2分别为A2断面的春/夏/秋/冬;
★表示MLD,冬季时缺A34、A28、A11的数据Figure 3. Mixed layer features in A47 and A2 section in four seasons
a1/b1/c1/d1 are spring/summer/autumn/winter of A47 section,and a2/b2/c2/d2 were spring/summer/autumn/winter of A2 section;
★indicates MLD;data of A34,A28 and A11 in winter were lacked.![]()
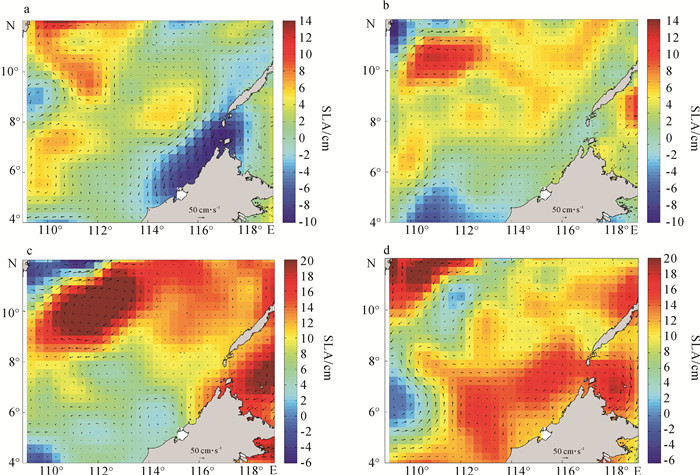
图 4 调查期间的海面高度异常和地转流矢量分布图
a.20130327;b.20130702;c.20130918;d.20131125
Figure 4. Sea level anomalies and geostrophic circulation distribution map
![]()
图 5 四季海表10 m平均温度平面分布图(℃)
a、b、c、d分别为春、夏、秋、冬季
Figure 5. Spatial distribution of average temperature of 10 m surface water in four seasons (℃)
a,b,c,d indicate spring,summer,autumn,winter,respectively.
-
[1] LIM S H,JANG C J,PARK J J. Climatology of the mixed layer depth in the East/Japan Sea[J].J Mar Syst,2012,96:1-14. doi: 10.1016/j.jmarsys.2012.01.003
[2] 范聪慧. 多因素对海洋上混合层深度影响的数值模拟[D]. 北京: 中国科学院研究生院, 2007. https://xueshu.baidu.com/usercenter/paper/show?paperid=6e3a500b4c5a942eba179b5c7ec41c7c&site=xueshu_se&hitarticle=1 [3] 施平, 杜岩, 王东晓, 等. 南海混合层年循环特征[J]. 热带海洋学报, 2001, 20(1): 10-16. doi: 10.3969/j.issn.1009-5470.2001.01.002 [4] KUMAR S P, NARVEKAR J. Seasonal variability of the mixed layer in the central Arabian Sea and its implication on nutrients and primary productivity[J]. Deep Sea Res Ⅱ, 2005, 52(14): 1848-1861. doi: 10.1016/j.dsr2.2005.06.002
[5] PERALTA-FERRIZ C, WOODGATE R A. Seasonal and interannual variability of pan-Arctic surface mixed layer properties from 1979 to 2012 from hydrographic data, and the dominance of stratification for multiyear mixed layer depth shoaling[J]. Prog Oceanogr, 2015, 134: 19-53. doi: 10.1016/j.pocean.2014.12.005
[6] AYOUB N K, LUCAS M, de MEY P. Estimating uncertainties on a Gulf Stream mixed-layer heat budget from stochastic modeling[J]. J Mar Syst, 2015, 150: 66-79. doi: 10.1016/j.jmarsys.2015.04.008
[7] HOUPERT L, TESTOR P, de MADRON X D, et al. Seasonal cycle of the mixed layer, the seasonal thermocline and the upper-ocean heat storage rate in the Mediterranean Sea derived from observations[J]. Prog Oceanogr, 2015, 132: 333-352. doi: 10.1016/j.pocean.2014.11.004
[8] SWART S, THOMALLA S J, MONTEIRO P M S. The seasonal cycle of mixed layer dynamics and phytoplankton biomass in the sub-antarctic zone: a high-resolution glider experiment[J]. J Mar Syst, 2015, 147: 103-115. doi: 10.1016/j.jmarsys.2014.06.002
[9] MIZOBATA K, SHIMADA K. East-west asymmetry in surface mixed layer and ocean heat content in the Pacific sector of the Arctic Ocean derived from AMSR-E sea surface temperature[J]. Deep Sea Res Ⅱ, 2012, 77: 62-69. doi: 10.1016/j.dsr2.2012.04.005
[10] ZG KMEN T M, POJE A C, FISCHER P F, et al. Large eddy simulations of mixed layer instabilities and sampling strategies[J]. Ocean Model, 2011, 39(3): 311-331. doi: 10.1016/j.ocemod.2011.05.006
[11] HALKIDES D, LEE T. Mechanisms controlling seasonal mixed layer temperature and salinity in the southwestern tropical Indian Ocean[J]. Dynam Atmos Oceans, 2011, 51(3): 77-93. doi: 10.1016/j.dynatmoce.2011.03.002
[12] 唐峰华, 崔雪森, 杨胜龙, 等. 海洋环境对中西太平洋金枪鱼围网渔场影响的GIS时空分析[J]. 南方水产科学, 2014, 10(2): 18-26. doi: 10.3969/j.issn.2095-0780.2014.02.003 [13] 陈春光, 张敏, 邹晓荣, 等. 东南太平洋智利竹筴鱼中心渔场的月间变动研究[J]. 南方水产科学, 2015, 10(5): 60-67. doi: 10.3969/j.issn.2095-0780.2014.05.009 [14] 江艳娥, 陈作志, 林昭进, 等. 南海中部海域鸢乌贼耳石形态特征分析[J]. 南方水产科学, 2014, 10(4): 85-90. doi: 10.3969/j.issn.2095-0780.2014.04.014 [15] EGGERT A, SCHNEIDER B. A nitrogen source in spring in the surface mixed-layer of the Baltic Sea: evidence from total nitrogen and total phosphorus data[J]. J Mar Syst, 2015, 148: 39-47. doi: 10.1016/j.jmarsys.2015.01.005
[16] BAG IEN E, MELLE W, KAARTVEDT S. Seasonal development of mixed layer depths, nutrients, chlorophyll and Calanus finmarchicus in the Norwegian Sea: a basin-scale habitat comparison[J]. Prog Oceanogr, 2012, 103: 58-79. doi: 10.1016/j.pocean.2012.04.014
[17] ROUSSEAUX C S G, LOWE R, FENG M, et al. The role of the Leeuwin Current and mixed layer depth on the autumn phytoplankton bloom off Ningaloo Reef, Western Australia[J]. Cont Shelf Res, 2012, 32: 22-35. doi: 10.1016/j.csr.2011.10.010
[18] WANG J J, TANG D L, SUI Y. Winter phytoplankton bloom induced by subsurface upwelling and mixed layer entrainment southwest of Luzon Strait[J]. J Mar Syst, 2010, 83(3): 141-149. doi: 10.1016/j.jmarsys.2010.05.006
[19] RYABOV A B, RUDOLF L, BLASIUS B. Vertical distribution and composition of phytoplankton under the influence of an upper mixed layer[J]. J Theor Biol, 2010, 263(1): 120-133. doi: 10.1016/j.jtbi.2009.10.034
[20] ZHAI L, PLATT T, TANG C, et al. Seasonal and geographic variations in phytoplankton losses from the mixed layer on the Northwest Atlantic Shelf[J]. J Mar Syst, 2010, 80(1): 36-46. doi: 10.1016/j.jmarsys.2009.09.005
[21] FRANTS M, GILLE S T, HATTA M, et al. Analysis of horizontal and vertical processes contributing to natural iron supply in the mixed layer in southern Drake Passage[J]. Deep Sea Res Ⅱ, 2013, 90: 68-76. doi: 10.1016/j.dsr2.2012.06.001
[22] TAILLANDIER V, D′ORTENZIO F, ANTOINE D. Carbon fluxes in the mixed layer of the Mediterranean Sea in the 1980s and the 2000s[J]. Deep Sea ResⅠ, 2012, 65: 73-84. doi: 10.1016/j.dsr.2012.03.004
[23] NARVEKAR J, KUMAR S P. Seasonal variability of the mixed layer in the central Bay of Bengal and associated changes in nutrients and chlorophyll[J]. Deep Sea ResⅠ, 2006, 53(5): 820-835. doi: 10.1016/j.dsr.2006.01.012
[24] 何有海, 关翠华, 王盛安, 等. 南海南部热结构和水温的垂直分布[C]//南沙群岛海区物理海洋学研究论文集Ⅰ. 北京: 海洋出版社, 1994: 10-27. [25] 杜岩. 南海混合层和温跃层的季节动力过程[D]. 青岛: 青岛海洋大学, 2002. https://xueshu.baidu.com/usercenter/paper/show?paperid=8b3a3544379327f927e77e28e018ba22&site=xueshu_se&hitarticle=1 [26] 刘秦玉, 贾旭晶, 孙即霖, 等. 1998年夏季风爆发前后南海上混合层的特征及成因[J]. 气候与环境研究, 2000, 5(4): 469-481. doi: 10.3969/j.issn.1006-9585.2000.04.012 [27] 刘辉, 江丽芳, 齐义泉, 等. 南沙群岛海域混合层深度季节变化特征[J]. 海洋科学进展, 2007, 25(3): 268-279. doi: 10.3969/j.issn.1671-6647.2007.03.003 [28] LUKAS R, LINDSTROM E. The mixed layer of the western equatorial Pacific Ocean[J]. J Geophys Res, 1991, 96: 3343-3357. doi: 10.1029/90JC01951
[29] 贾旭晶, 刘秦玉, 孙即霖. 1998年5-6月南海上混合层、温跃层不同定义的比较[J]. 海洋湖沼通报, 2001(1): 1-6. doi: 10.3969/j.issn.1003-6482.2001.01.001 [30] De BOYER MONT GUT C, MADEC G, FISCHER A S, et al. Mixed layer depth over the global ocean: an examination of profile data and a profile-based climatology[J]. J Geophys Res: Oceans (1978-2012), 2004, 109(C12): doi: 10.1029/2004JC002378.
[31] KARA A B, ROCHFORD P A, HURLBURT H E. An optimal definition for ocean mixed layer depth[J]. J Geophys Res: Oceans (1978-2012), 2000, 105(C7): 16803-16821. doi: 10.1029/2000JC900072
[32] BRAINERD K E, GREGG M C. Surface mixed and mixing layer depths[J]. Deep Sea ResⅠ, 1995, 42(9): 1521-1543. doi: 10.1016/0967-0637(95)00068-H
[33] HUANG R X, QIU B. Three-dimensional structure of the wind-driven circulation in the subtropical North Pacific[J]. J Phys Oceanogr, 1994, 24(7): 1608-1622. doi: 10.1175/1520-0485(1994)024<1608:TDSOTW>2.0.CO;2
[34] 关皓, 周林, 施伟来, 等. 热带太平洋-印度洋上层海温、热含量和混合层深度的年变化特征[J]. 海洋预报, 2006, 23(增): 47-59. https://xueshu.baidu.com/usercenter/paper/show?paperid=a6082c73ac75a9147507d984806e9afe [35] 邱章, 徐锡祯, 龙小敏. 1994年9月南沙群岛调查海区的跃层特征[J]. 热带海洋, 1996, 15(2): 61-67. [36] HAYES S P, CHANG P, MCPHADEN M J. Variability of the sea surface temperature in the eastern equatorial Pacific during 1986-1988[J]. J Geophys Res: Oceans (1978-2012), 1991, 96(C6): 10553-10566. doi: 10.1029/91JC00942
[37] 方文东, 郭忠信, 黄羽庭. 南海南部海区的环流观测研究[J]. 科学通报, 1997, 42(21): 2264-2271. doi: 10.1360/csb1997-42-21-2264 [38] CHU P C, CHANG C P. South China Sea warm pool in boreal spring[J]. Adv Atmos Sci, 1997, 14(2): 195-206. doi: 10.1007/s00376-997-0019-8
-
期刊类型引用(10)
1. 刘永新,邵长伟,郑先虎. 中国淡水重要养殖鱼类抗病和抗逆性状育种研究进展. 水产学报. 2025(02): 4-21 .  百度学术
百度学术
2. 张元,刘志刚,王春德,姚高友,张柯馨,展建强,陈麟广,吕文刚,钟茂程,刘付少梅. 扇贝新品系“紫海墨”F_4的生长特征和生产性能分析. 南方水产科学. 2022(01): 68-76 . 本站查看
3. 申奔龙,薛宝宝,孟德龙,沈和定. 缢蛏早期耐高温家系建立及抗氧化能力测定. 浙江农业学报. 2022(02): 266-274 . 百度学术
4. 朱佳杰,敖秋桅,谭芸,罗永巨,蒋和生. 吉富罗非鱼组蛋白酶B基因克隆及无乳链球菌感染后的表达分析. 南方农业学报. 2022(08): 2294-2301 . 百度学术
5. 周欣,高风英,卢迈新. 鱼类抗病育种研究进展. 大连海洋大学学报. 2021(03): 510-523 . 百度学术
6. 严楚,彭凯,张志妮. 罗非鱼链球菌综合防控技术研究进展. 广东畜牧兽医科技. 2021(06): 13-16 . 百度学术
7. 敖秋桅,朱佳杰. 3个罗非鱼种群对4种病原菌的抗病力差异比较. 南方农业学报. 2020(03): 695-701 . 百度学术
8. 付璐璐,王峥,王磊,李学军. 近10年水产动物抗逆育种研究进展. 江苏农业科学. 2020(16): 52-58 . 百度学术
9. 方佳峰,李琪. 长牡蛎壳橙品系幼虫和稚贝的生长性状遗传参数评估. 中国海洋大学学报(自然科学版). 2020(11): 38-44 . 百度学术
10. 郑雄,赵立朝,吴志强,张洁,黄亮亮,汪开成,张曼. 广西右江流域野生罗非鱼种群及其杂合性研究. 南方农业学报. 2019(12): 2797-2805 . 百度学术
其他类型引用(8)
 下载:
下载:
计量
- 文章访问数:
- HTML全文浏览量:
- PDF下载量:
- 被引次数: 18
 粤公网安备 44010502001741号
