
Comparison of morphological characteristics of 9 Larimichthys polyactis populations in China
-
摘要:
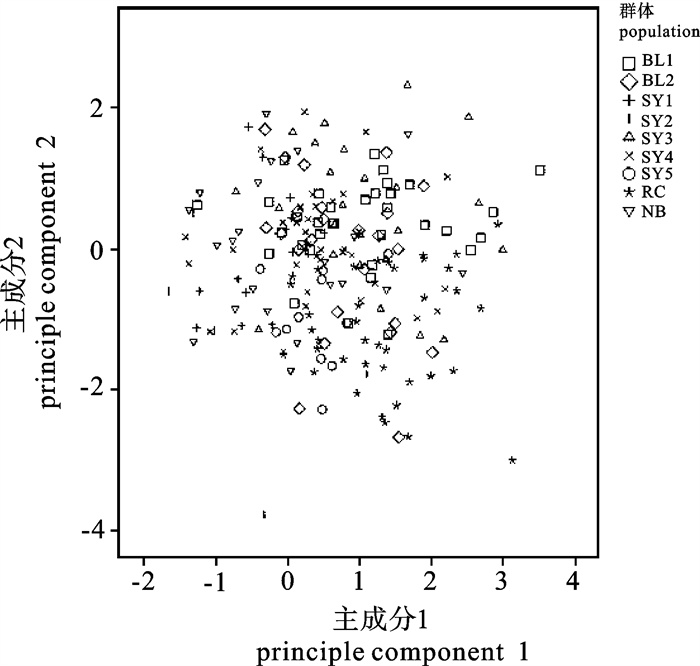
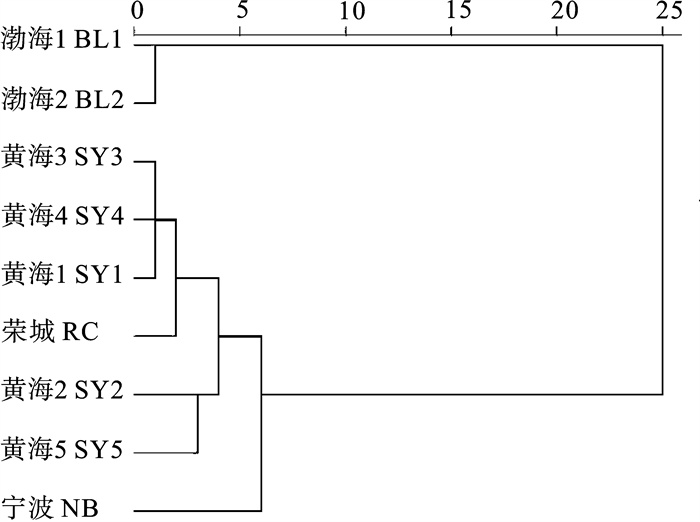
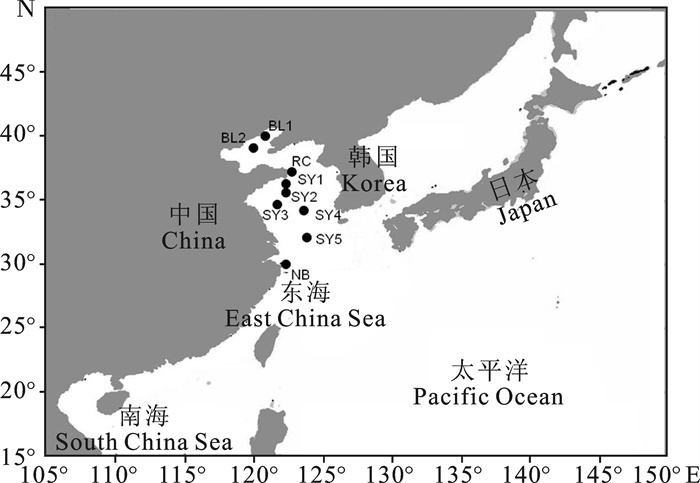
对2005年~2010年采自渤海、黄海和东海海域的9个小黄鱼(Larimichthys polyactis)群体共208个个体进行了形态学比较研究,运用主成分分析、判别分析、聚类分析和单因子方差分析等多元统计分析方法对9个小黄鱼地理群体的20个量度特征和8个分节特征进行分析。结果显示,判别分析的综合判别率为73.6%。其中东海(宁波)群体判别率最高(86.4%);黄海SY4群体判别率最低(54.3%)。主成分分析、聚类分析和单因子方差分析结果一致,均显示渤海群体与黄海、东海群体间存在一定程度的分化。
Abstract:To compare the morphological differences among 9 small yellow croaker (Larimichthys polyactis) populations, we analyzed 20 morphological characteristics and 8 meristic counts of 208 individuals collected from Bohai Sea, Yellow Sea and East China Sea during 2005~2010 by using multivariate statistical analysis (principal component analysis, discriminant analysis, cluster analysis and One-Way ANOVA). The results show that the total accuracy of discrimination for the 9 populations is 73.6%, with the highest 86.4% in Ningbo and the lowest 54.3% in SY4. The results of principal component analysis, cluster analysis and One-Way ANOVA are consistent, which indicates that geographical variance exists between Bohai Sea population and other populations from Yellow Sea and East China Sea.
-
长鳍金枪鱼(Thunnus alalunga)是南太平洋延绳钓金枪鱼渔业的重要目标种类,也是中国金枪鱼延绳钓渔船的主捕对象之一[1]。联合国粮农组织(FAO)2010年统计数据显示,南太平洋海域长鳍金枪鱼产量为15.29×10⁴ t,占当年全球长鳍金枪鱼总产量的63%,中国渔船于1998年开始进入该海域进行长鳍金枪鱼延绳钓作业,近年来其产量和作业规模总体呈现出波动增长的趋势[2-3]。相关资源评估报告表明,目前南太平洋长鳍金枪鱼资源状态总体较好,仍具有一定的开发潜力[4]。远洋性鱼类,尤其是金枪鱼,为捕食深海散射层(deep scattering layer,DSL)生物,都具有“昼潜夜浮”的特性[5]。ZAGAGLIA等[6]认为这种垂直方向上的昼夜移动,会使得金枪鱼垂直活动水层与次表层水温的关系更为密切。DOMOKOS等[7]通过在美属萨摩亚群岛附近海域进行成年长鳍金枪鱼标志放流研究发现,长鳍金枪鱼在18~30 ℃水层均有分布,其中65%~70%的时间在20~25 ℃水层活动。延绳钓调查也得出相似结论,林显鹏等[8]在南太平洋所罗门群岛以及杨嘉樑等[9]在东太平洋库克群岛附近海域进行延绳钓调查得出,长鳍金枪鱼适宜栖息水温分别为20~26 ℃以及20~25 ℃。上述研究结果表明,水温垂直结构对长鳍金枪鱼垂直活动水层的分布有直接影响,同时也是长鳍金枪鱼渔场形成过程中极为重要的因素之一。因此,分析南太平洋长鳍金枪鱼的垂直活动水层分布特征,了解其适宜的垂直活动水层深度范围十分有必要。以往对长鳍金枪鱼垂直活动水层的研究主要依靠标志放流和延绳钓调查,但标志放流和延绳钓调查的区域跨度小且在时间上不连续,无法大面积、长时间序列的监测海洋次表层环境变化对长鳍金枪鱼资源分布的影响。该研究根据前人标志放流和延绳钓调查所得结论,采用Argo数据重构了南太平洋次表层20 ℃和25 ℃等温线深度场,结合2010年~2012年中水集团长鳍金枪鱼延绳钓生产统计数据,分析了南太平洋长鳍金枪鱼的垂直分布特征,并采用数值方法计算其适宜的垂直活动水层深度,以期为南太平洋延绳钓长鳍金枪鱼捕捞作业、资源保护和管理提供参考。
1. 材料与方法
1.1 数据
1.1.1 渔业数据
渔业数据来源于中水集团南太平洋长鳍金枪鱼延绳钓船队的21艘延绳钓渔船渔捞日志,数据包括作业时间、作业位置、渔获量、渔获尾数、下钩数等信息,时间为2010年~2012年,空间范围为5°S~21°S、155°E~180°E,具体研究区域见图 1。在实际分析统计中,以1°×1°为空间统计单元,并按月计算各1°×1°渔区网格内的单位捕捞努力量渔获量(catch per unit effort,CPUE)。
![]() 图 1 南太平洋长鳍金枪鱼渔场范围示意图Figure 1. Map of fishing ground of albacore tuna in the South Pacific Ocean
图 1 南太平洋长鳍金枪鱼渔场范围示意图Figure 1. Map of fishing ground of albacore tuna in the South Pacific OceanCPUE计算公式如下[10]:
$$ \operatorname{CPUE}_{(i, j)}=\frac{N_{f is h(i, j)} \times 1\;000}{N_{h o o k(i, j)}} $$ (1) 式中CPUE(i, j)、Nfish(i, j)、Nhook(i, j)分别是第i个经度、第j个纬度所处渔区网格内的CPUE(尾·千钩-1)、渔获尾数和实际下钩数。随后计算2010年~2012年各月各渔区网格内所有CPUE值的四分位数(Q1~Q3),并将所有大于Q3(第3个四分位点)的CPUE称为高值CPUE,其所属渔区定义为南太平洋长鳍金枪鱼的中心渔场[11]。2010年~2012年按月统计的1°×1°渔区网格内CPUE样本数共1 939个,其中高值CPUE样本485个,CPUE的四分位数划分如下:Q1=7.27尾·千钩-1,Q2=11.23尾·千钩-1,Q3=15.78尾·千钩-1。
1.1.2 Argo数据
综合前人标志放流和延绳钓调查所得结论,选取20 ℃和25 ℃分别作为南太平洋长鳍金枪鱼适宜栖息水温的下界和上界,用于分析其垂直活动水层分布特征及适宜的垂直活动水层深度范围。2010年~2012年南太平洋次表层20 ℃和25 ℃等温线深度数据来源于中国Argo实时数据中心(http://www.argo.org.cn/)。文章采用杨胜龙等[12]的方法将离散分布的Argo剖面深度数据,等距插值到规则等温线层上,垂直等距间隔为1 m。将2010年~2012年所有Argo数据按月进行分组,分别提取20 ℃和25 ℃等温面上离散分布的深度值,并采用Kriging插值方法将其插值到1°×1°网格节点上。
1.2 方法
1.2.1 空间分析
将2010年~2012年南太平洋次表层20 ℃和25 ℃等温线深度数据与长鳍金枪鱼CPUE数据按月进行空间匹配,采用空间分析软件Arcgis绘制20 ℃和25 ℃等温线深度与CPUE空间叠加分布图。根据南半球的季节划分(1月~3月为夏季、4月~6月为秋季、7月~9月为冬季、10月~12月为春季),分析不同季节下长鳍金枪鱼CPUE与20 ℃和25 ℃等温线深度的时空分布特征及其动态变化规律。
1.2.2 垂直活动水层深度计算
采用频次分析和经验累积分布函数(empirical cumulative distribution function,ECDF)相结合的方法,计算南太平洋长鳍金枪鱼适宜的垂直活动水层深度范围[13]。1)计算南太平洋长鳍金枪鱼中心渔场20 ℃和25 ℃等温线深度的平均值、均方差及适宜的垂直活动水层深度区间(平均值±均方差);2)计算高值CPUE与20 ℃和25 ℃等温线深度的经验累积分布函数及适宜的垂直活动水层深度区间[最大D(t)处深度值±均方差];取两者交集,即为长鳍金枪鱼适宜的垂直活动水层深度。
ECDF计算方法如下[14]:
$$ f(t)=\frac{1}{n} \sum\limits_{i=1}^n l\left(x_i\right) \quad l\left(x_i\right)= \begin{cases}1, & x_i \leq t \\ 0, & x_i>t\end{cases} $$ (2) $$ g(t)=\frac{1}{n} \sum\limits_{i=1}^n \frac{y_i}{\bar{y}} $$ (3) $$ D(t)=|f(t)-g(t)| $$ (4) 式中f(t)为深度值的经验累积分布函数,g(t)为高值CPUE与深度的加权经验累积分布函数,l(t)为分段函数,D(t)为t时刻处f(t)与g(t)差的绝对值。n为高值CPUE样本个数;t是以1 m为间距从低到高排列的深度范围序列;xi为第i个样本对应的深度值;yi为第i个样本对应的CPUE;y为所有高值CPUE样本的平均值;根据给定的显著性水平α=0.05,采用双样本K-S(Kolmogorov-Smirnov)检验方法分别检验高值CPUE与20 ℃和25 ℃等温线深度间的关系。
2. 结果与分析
2.1 长鳍金枪鱼垂直活动水层空间分析
2010年~2012年南太平洋长鳍金枪鱼CPUE与20 ℃等温线深度的月平均空间分布见图 2。20 ℃等温线深度大致以15°S为中心,呈南北对称分布,且存在明显的季节性变化,长鳍金枪鱼CPUE的时空分布与20 ℃等温线深度的220 m等深线时空变动特征具有明显的相关性。1月,研究海域内20 ℃等温线深度基本在220 m以上,深度为220~230 m区域占整个研究海域面积的比例较大,高值CPUE主要分布于12°S~18°S,深度为220~240 m的海域,瓦努阿图东北部,20 ℃等温线深度小于220 m的海域,也有少量高值CPUE分布;2月~3月,研究海域南部的20 ℃等温线深度略有下降,中心渔场开始北移,渔场分布的纬度范围变窄,瓦努阿图东北部渔场消失,而深度为220~230 m的区域面积则进一步扩张,约占整个研究海域面积的一半;秋季(4月~6月),随着作业渔船数量的增加,高值CPUE的个数及分布范围均有所拓展,220 m等深线较1月~3月有明显的向南移动趋势,20 ℃等温线深度为220~230 m的海域面积开始逐步缩小,中心渔场所在区域20 ℃等温线深度则逐步加深,20 ℃等温线深度超过230 m的中心渔场数量显著增加,随着220 m等深线的南移,研究区域北部20 ℃水层的深度开始逐步变浅,而研究海域南部20 ℃等温线深度则开始逐步加深;从冬季(7月~9月)开始,10°S以北海域20 ℃等温线深度已基本全部处于220 m以下,此处区域全年均少有渔场出现,中心渔场位置开始逐步向南移动,深度为220~240 m的区域面积进一步缩小,渔场分布的纬度范围开始重新收窄;春季(10~12月),中心渔场继续向南移动,中心渔场所处海域的20 ℃等温线深度则继续加深,到12月,南太平洋长鳍金枪鱼中心渔场已完全分布于15°S以南,中心渔场所在海域的20 ℃等温线深度下界也随之拓展到250 m。
![]() 图 2 各月平均20 ℃等温线深度与平均CPUE空间叠加图Figure 2. Overlay map of average isothermal depths at 20 ℃ and average CPUE in each month
图 2 各月平均20 ℃等温线深度与平均CPUE空间叠加图Figure 2. Overlay map of average isothermal depths at 20 ℃ and average CPUE in each month2010年~2012年南太平洋长鳍金枪鱼CPUE与25 ℃等温线深度的月平均空间分布见图 3。25 ℃等温线深度大致呈由北向南逐步递减的纬向带状分布。25 ℃等温线深度也存在明显的季节性变化,长鳍金枪鱼中心渔场的时空分布与25 ℃等温线深度的140 m等深线季节性变化趋势具有明显的相关性。1月,长鳍金枪鱼高值CPUE主要分布于25 ℃等温线深度为100~140 m的海域,瓦努阿图东北部,25 ℃等温线水深在80 m以下的海域,也有少量高值CPUE分布;2月~3月,中心渔场逐步北移,中心渔场对应的25 ℃等温线深度范围变窄,瓦努阿图东北部渔场消失;秋季(4月~6月),随着研究海域内捕捞努力量的增加,中心渔场的数量和空间分布范围均有所拓展,140 m等深线开始逐步南移,水深为140~160 m的海域面积不断扩张,中心渔场对应的25 ℃等温线深度范围拓宽至80~160 m;冬季(7月~9月),研究海域北部25 ℃等温线深度开始加深,140~160 m水深海域面积达到全年最大值,140 m等深线已完全分布于15°S以南,中心渔场对应的25 ℃等温线深度也随之变浅至80~150 m,研究海域南部25 ℃等温线深度开始变浅,中心渔场也随着140 m等深线的变动而向南转移,此处海域等深线分布密集,水层结构较为复杂,同时也是长鳍金枪鱼高值CPUE密集分布的海域;从春季(10月~12月)开始,140 m等深线开始北移,研究海域北部25 ℃等温线深度逐渐变浅,140~160 m水深的海域面积逐渐缩小,而在研究海域南部,25 ℃等温线深度则开始逐步加深,随着研究海域南部25 ℃等温线深度的增加,长鳍金枪鱼中心渔场的分布也随之不断南移,到12月,长鳍金枪鱼中心渔场已完全分布于15°S以南,中心渔场对应的25 ℃等温线深度范围缩小至80~120 m。
![]() 图 3 各月平均25℃等温线深度与平均CPUE空间叠加图Figure 3. Overlay map of average isothermal depths at 25 ℃ and average CPUE in each month
图 3 各月平均25℃等温线深度与平均CPUE空间叠加图Figure 3. Overlay map of average isothermal depths at 25 ℃ and average CPUE in each month2.2 长鳍金枪鱼适宜垂直活动水层深度计算
2010年~2012年南太平洋长鳍金枪鱼中心渔场所在区域,20 ℃等温线深度在181~272 m,25 ℃等温线深度在41~201 m均有分布。长鳍金枪鱼高值CPUE与20 ℃和25 ℃等温线深度的频次分布直方图(图 4)呈现出明显的偏正态分布趋势,20 ℃等温线深度平均值为227 m、均方差为18,25 ℃等温线深度平均值为115 m,均方差为27。采用频次分析方法计算得出,71%的长鳍金枪鱼中心渔场趋向于集中分布在20 ℃等温线深度为209~245 m(227±18)的海域,70%的长鳍金枪鱼中心渔场趋向于集中分布在25 ℃等温线深度为88~142 m(115±27)的海域。
![]() 图 4 长鳍金枪鱼高值CPUE与20 ℃和25 ℃等温线深度频次分布直方图Figure 4. Frequency distribution histogram of high CPUE and isothermal depths at 20 ℃ and 25 ℃
图 4 长鳍金枪鱼高值CPUE与20 ℃和25 ℃等温线深度频次分布直方图Figure 4. Frequency distribution histogram of high CPUE and isothermal depths at 20 ℃ and 25 ℃采用K-S检验方法对长鳍金枪鱼高值CPUE与20 ℃和25 ℃等温线深度之间的关系进行检验,样本数为485,在给定显著性水平α=0.05下,得出D0.05=0.061 7。ECDF分析结果见图 5。20 ℃和25 ℃等温线深度对应的最大D(t)值分别为0.026 9和0.025 1,均远小于D0.05,表明样本间服从同一分布,长鳍金枪鱼高值CPUE与20 ℃和25 ℃等温线深度间有密切关系。20 ℃和25 ℃等温线深度对应的最大D(t)值分别出现在220 m和111 m,与中心渔场20 ℃和25 ℃等温线深度的均值稍有差异(分别为227 m和115 m)。采用ECDF方法得出长鳍金枪鱼中心渔场20 ℃和25 ℃等温线深度分别为202~238 m(220±18)、84~138 m(111±27)。综合频次分析和ECDF分析的结果,取两者交集,得出南太平洋长鳍金枪鱼适宜的垂直活动水层深度为88~238 m。
![]() 图 5 长鳍金枪鱼高值CPUE与20 ℃和25 ℃等温线深度值的经验累积分布函数Figure 5. ECDF for high CPUE of albacore tuna and isothermal depths at 20 ℃ and 25 ℃
图 5 长鳍金枪鱼高值CPUE与20 ℃和25 ℃等温线深度值的经验累积分布函数Figure 5. ECDF for high CPUE of albacore tuna and isothermal depths at 20 ℃ and 25 ℃3. 讨论
3.1 长鳍金枪鱼渔场分布与20 ℃、25 ℃等温线深度的关系
以往对南太平洋长鳍金枪鱼渔场环境的研究,采用的多是遥感获取的海表面环境因子[15-19]。但标志放流和延绳钓调查结果表明,长鳍金枪鱼多分布于80 m以深的水层,10 m以浅的近表层很少有长鳍金枪鱼活动[20-21]。因此,相较于表层环境因子,采用次表层环境变量分析长鳍金枪鱼的栖息环境更为适合。长鳍金枪鱼耳石研究发现,长鳍金枪鱼经常出没于海洋环境变化较大的水层,如温跃层和混合层[22]。笔者在研究过程中也发现,15°S以南,长鳍金枪鱼高值CPUE密集分布的海域,其25 ℃等温线深度的等深线分布也十分密集,推测此处可能有混合层存在(图 3)。以往的研究中,常用20 ℃等温线深度来表示太平洋海域温跃层的深度,表明在太平洋海域次表层20 ℃等温线分布与温跃层的分布十分相似[23-24]。DOMOKOS等[6]指出,长鳍金枪鱼白天下潜至温跃层以下觅食DSL生物,夜晚则游回混合层上方,混合层及温跃层的深度直接影响到长鳍金枪鱼垂直活动水层的深度。对太平洋海域DSL生物的调查研究发现,DSL生物白天主要分布于温跃层以下,夜晚则分布于温跃层以上[25]。据此推断,20 ℃等温线可能通过影响DSL生物的垂直分布,进而影响长鳍金枪鱼垂直活动水层的空间分布。
K-S检验结果表明,长鳍金枪鱼高值CPUE与20 ℃和25 ℃等温线深度之间有密切关系。长鳍金枪鱼中心渔场所处海域,其20 ℃等温线深度多在220 m以深,超过250 m则少有中心渔场出现;25 ℃等温线深度多在140 m以浅,浅于80 m则少有中心渔场出现。长鳍金枪鱼高值CPUE与20 ℃和25 ℃等温线深度的时空分布均呈现出明显的季节性变化特征,20 ℃和25 ℃等温线深度的这种季节性变化进而导致长鳍金枪鱼垂直活动水层深度的季节性变化。长鳍金枪鱼中心渔场的时空分布与20 ℃等温线深度的220 m等深线和25 ℃等温线深度的140 m等深线的时空变动具有显著的相关性,进一步表明水温垂直结构对长鳍金枪鱼的垂直活动水层深度及渔场分布有直接影响。
3.2 长鳍金枪鱼适宜垂直活动水层深度分析
综合频次分析和ECDF方法计算得出,南太平洋长鳍金枪鱼适宜的垂直活动水层深度为88~238 m。所得结果在中西太平洋长鳍金枪鱼垂直分布水层(80~380 m)之内[19],与临近的所罗门群岛附近海域长鳍金枪鱼活动较为频繁的水层(130~190 m)相符[7],与相似纬度的东太平洋海域成年长鳍金枪鱼钓获深度(102.3~236.1 m)基本相同[26],与东南太平洋长鳍金枪鱼延绳钓钓获深度(74.33~296.50 m)相似[27]。文章初步得出了南太平洋长鳍金枪鱼适宜的垂直活动水层深度范围,在实际的长鳍金枪鱼延绳钓生产作业中,应尽可能使延绳钓钓钩沉降至88~238 m,从而有效节省饵料投放、提高长鳍金枪鱼的生产效率。
4. 展望
文章从次表层水温垂直结构的角度研究了南太平洋长鳍金枪鱼的垂直活动水层分布特征及其适宜的垂直活动水层深度范围,事实上,长鳍金枪鱼的垂直分布还受到海流、溶解氧、海水盐度、饵料生物分布等其他诸多环境因素的共同影响[28-30]。Argo数据可以实时获取次表层水温、水深、盐度以及溶解氧等信息,极大地拓展了远洋渔业资源和渔场学研究中海洋环境因子的选择范围,在远洋渔业研究中有着良好的应用前景。综合多种环境因子,恰当地选择神经网络、支持向量机、栖息地适应性指数等预报模型,准确、全面地把握渔场时空分布,是今后中国长鳍金枪鱼渔业研究的一个重要方向。
致谢: 纪东平、张磊、陈澄璟和潘晓哲在样品采集和试验过程中给予了帮助,谨此致谢! -
![]()
图 2 小黄鱼9个群体的第一、二主成分散点图
Figure 2. Scatter plot of first and second principle components from PCA of 9 L.polyactis populations
![]()
图 3 小黄鱼9个群体的聚类关系图
Figure 3. Dendrogram of relationship among 9 L.polyactis populations
表 1 小黄鱼样品信息
Table 1 Sample information of L.polyactis
采集地sampling site 群体population 采样地点sampling location 采样时间sampling date 数量number of sample 体长范围/cm length range 体质量范围/g weight range 体长、体质量关系relationship between body length and weight 渤海Bohai Sea 渤海1 BL1 40°15′N,121°45′E 2007-10 34 81.8~180.3 6.9~100.0 W=5×10⁻⁶L3.227 5R2=0.959 5 渤海2 BL2 39°45′N,120°45′E 2007-10 24 76.3~143.6 5.3~43.0 W=3×10⁻⁶L3.296 7R2=0.971 0 黄海Yellow Sea 荣成 RC 37°15′N,122°45′E 2010-08 39 80.7~114.5 9.5~23.5 W=2×10⁻⁵L3.004 4 R2=0.922 9 黄海1 SY1 36°15′N,122°15′E 2005-10 13 84.2~189.2 8.2~99.1 W=1×10⁻⁴L2.510 8R2=0.733 1 黄海2 SY2 35°45′N,122°15′E 2005-10 6 82.3~126.7 7.2~32.0 W=8×10⁻⁶L3.111 3R2=0.999 5 黄海3 SY3 35°15′N,121°45′E 2005-10 24 79.9~165.9 7.2~72.2 W=1×10⁻⁶L3.544 2R2=0.948 9 黄海4 SY4 34°45′N,123°15′E 2005-10 35 134.9~152.6 24.0~57.2 W=7×10⁻⁶L3.160 8R2=0.935 7 黄海5 SY5 30°45′N,123°45′E 2005-05 11 109.2~160.5 19.7~69.5 W=1×10⁻⁹L4.853 4R2=0.596 2 东海East China Sea 宁波 NB 30°15′N,122°15′E 2008-08 22 89.4~120.9 8.5~21.5 W=1×10⁻⁵L3.001 1R2=0.761 6  下载: 导出CSV
表 2 小黄鱼9个群体的分节特征
Table 2 Meristic counts of 9 L.polyactis populations
分节特征meristic count BL1 BL2 RC SY1 SY2 SY3 SY4 SY5 NB 第一背鳍鳍棘数first dorsal fin spine 8~10 (9.0) 9 (9.0) 9~10 (9.2) 9 (9.0) 9~10 (9.1) 8~9 (9.0) 9 (9.0) 8~10 (9.2) 9~10 (9.2) 第二背鳍鳍棘数second dorsal fin spine 1 (1.0) 1 (1.0) 1 (1.0) 1 (1.0) 1 (1.0) 1 (1.0) 1 (1.0) 1 (1.0) 1 (1.0) 第二背鳍鳍条数second dorsal fin ray 31~36 (33.1) 31~35 (33.2) 33~36 (34.6) 33~36 (35.0) 32~37 (35.0) 33~36 (34.7) 32~36 (34.2) 31~37 (34.0) 32~37 (34.3) 胸鳍条数pectoral fin ray 13~16 (14.3) 14~15 (14.4) 15~17 (16.0) 16 (16.0) 15~17 (15.9) 15~18 (16.1) 15~16 (15.6) 15~19 (16.1) 14~17 (15.4) 腹鳍棘数ventral fin spine 1 (1.0) 1 (1.0) 1 (1.0) 1 (1.0) 1 (1.0) 1 (1.0) 1 (1.0) 1 (1.0) 1 (1.0) 腹鳍条数ventral fin ray 5 (5.0) 5 (5.0) 5 (5.0) 5 (5.0) 5 (5.0) 5 (5.0) 5 (5.0) 5 (5.0) 5 (5.0) 臀鳍棘数anal fin spine 2 (2.0) 2 (2.0) 2 (2.0) 2 (2.0) 2 (2.0) 2 (2.0) 2 (2.0) 2 (2.0) 2 (2.0) 臀鳍条数anal fin ray 9~10 (9.5) 9~11 (9.6) 9~10 (9.9) 10~11 (10.8) 9~11 (10.3) 9~11 (10.1) 10~11 (10.8) 9~11 (10.3) 9~11 (9.9) 上鳃耙数upper gill raker 7~9 (8.1) 7~9 (7.8) 7~10 (9.3) 8~9 (8.8) 9~10 (9.7) 9~11 (9.7) 8~10 (9.4) 8~11 (9.7) 7~10 (8.9) 下鳃耙数lower gill raker 15~18 (17.1) 16~19 (17.5) 16~20 (18.2) 17~19 (18.3) 17~19 (17.9) 17~20 (18.3) 17~20 (18.7) 16~20 (18.1) 17~20 (18.6) 脊椎骨数vertebra 27~29 (27.6) 27~29 (27.5) 28~29 (28.3) 28~29 (28.3) 27~29 (28.0) 27~28 (27.9) 27~29 (28.1) 28 (28.0) 27~30 (28.7) 注:括号内为平均值
Note: Numbers in the brackets are mean values.
下载: 导出CSV
表 3 小黄鱼群体的主成分分析
Table 3 Analysis of principal component of L.polyactis populations
主成分principal component 1 2 3 4 5 6 7 特征值eigenvalue 3.146 2.609 2.237 1.888 1.504 1.317 1.147 累积贡献率/% cumulative coutribution rate 18.507 33.856 47.016 58.121 66.966 74.711 81.458
下载: 导出CSV
表 4 小黄鱼17个可量性状主成分分析的因子负荷值
Table 4 Factor loadings of principal components extracted from 17 morphological characteristics of 9 L.polyactis populations
性状characteristic 主成分1 PC1 主成分2 PC2 主成分3 PC3 x1 -0.635 0.215 0.297 x2 -0.511 0.358 -0.126 x3 0.081 0.657 -0.419 x4 0.023 -0.207 0.486 x5 0.667 0.552 -0.236 x6 0.555 0.457 -0.188 x7 -0.063 0.522 0.073 x8 0.113 0.234 0.383 x9 -0.169 0.760 0.346 x10 -0.685 0.404 -0.080 x11 -0.401 -0.019 -0.477 x12 -0.259 0.438 0.399 x13 0.470 -0.113 -0.321 x14 0.388 0.197 -0.452 x15 0.537 0.290 0.445 x16 0.347 -0.189 0.518 x17 0.445 0.120 0.436
下载: 导出CSV
表 5 9个小黄鱼群体量度特征的单因子方差分析结果(平均值±标准差)及差异系数
Table 5 Result of One-Way ANOVA (x±SD) and coefficient of difference for morphometrics of 9 L.polyactis populations
性状characteristic BL1 BL2 RC SY1 SY2 SY3 SY4 SY5 NB CD(max) X1 0.286±0.017ce 0.293±0.015ae 0.270±0.011d 0.307±0.011b 0.290±0.020ace 0.282±0.012c 0.290±0.012e 0.289±0.013ace 0.295±0.012ae 1.639 X2 0.208±0.026a 0.208±0.024a 0.223±0.038c 0.215±0.026ac 0.230±0.031abc 0.241±0.034b 0.242±0.021b 0.223±0.018abc 0.215±0.017ac 0.722 X3 0.312±0.022b 0.299±0.025ab 0.292±0.020a 0.282±0.230a 0.272±0.039ab 0.313±0.024b 0.304±0.023b 0.284±0.013a 0.308±0.017b 0.819 X4 0.493±0.037b 0.493±0.033b 0.474±0.026c 0.487±0.031bcd 0.511±0.038bd 0.439±0.031a 0.466±0.032cde 0.479±0.061bcde 0.494±0.020bd 1.085 X5 0.583±0.042a 0.574±0.033a 0.550±0.031def 0.515±0.045b 0.513±0.029be 0.586±0.037ae 0.566±0.035ac 0.539±0.015bdef 0.543±0.025ef 1.113 X6 0.378±0.024a 0.392±0.020ac 0.358±0.016b 0.368±0.019ab 0.339±0.017b 0.369±0.030abc 0.355±0.023b 0.352±0.017b 0.378±0.016a 1.439 X7 0.418±0.064ab 0.421±0.046ab 0.389±0.054ac 0.420±0.057abc 0.388±0.064abcd 0.397±0.050a 0.402±0.044a 0.440±0.076b 0.381±0.051acd 0.464 X8 2.821±0.313a 2.565±0.218b 2.855±0.232ace 2.991±0.169acef 3.062±0.318ce 3.209±0.365cdef 3.111±0.285cef 2.817±0.276ace 2.591±0.213b 1.104 X9 0.296±0.014a 0.296±0.015ac 0.277±0.014cd 0.311±0.013b 0.299±0.019abce 0.291±0.020ace 0.287±0.014ce 0.285±0.010c 0.299±0.015a 1.239 X10 0.307±0.011a 0.310±0.014a 0.291±0.009b 0.307±0.009a 0.296±0.021ab 0.299±0.009ab 0.302±0.010a 0.293±0.012ab 0.308±0.011a 0.877 X11 0.305±0.015ab 0.304±0.016ab 0.297±0.013a 0.305±0.013ab 0.305±0.023ab 0.299±0.010a 0.303±0.012ab 0.305±0.018ab 0.314±0.015b 0.287 X12 0.649±0.021bc 0.631±0.022a 0.653±0.017bcd 0.662±0.017b 0.659±0.019bcd 0.647±0.021c 0.655±0.025bcd 0.647±0.023bcd 0.662±0.019bd 0.429 X13 0.162±0.015a 0.160±0.014acd 0.175±0.015b 0.154±0.010ac 0.152±0.012acd 0.164±0.010ad 0.163±0.014ad 0.177±0.013b 0.153±0.012c 0.930 X14 0.429±0.028ac 0.408±0.028bc 0.423±0.026ac 0.428±0.019ac 0.444±0.017a 0.406±0.023b 0.419±0.021c 0.427±0.031ac 0.420±0.017c 0.966 X15 0.109±0.008a 0.108±0.013a 0.107±0.010abc 0.108±0.011a 0.099±0.010b 0.111±0.011ac 0.108±0.008a 0.103±0.010ab 0.111±0.008ac 0.556 X16 0.046±0.004a 0.048±0.005ab 0.049±0.004b 0.045±0.008a 0.043±0.003a 0.050±0.007b 0.049±0.005b 0.043±0.003ac 0.044±0.006ac 0.734 X17 0.038±0.005a 0.038±0.003a 0.043±0.005bd 0.038±0.004abe 0.036±0.001ac 0.043±0.005bde 0.041±0.004be 0.038±0.004a 0.034±0.005c 1.140 注:英文字母上标表示群体间的差异程度; 上标相同或包含关系表示差异不显著,上标不同或交集关系表示差异显著;差异系数为各群体间的最大值
Note: The superscripts indicate difference among populations. The same superscripts or containing relation indicate non-significant difference; different superscripts or intersection relation indicate significant difference. Coefficient of difference is the largest among 9 populations.
下载: 导出CSV
-
[1] CADRIN S X. Advances in morphometric identification of fishery stocks[J]. Rev Fish Bio Fish, 2000, 10(1): 91-112. doi: 10.1023/A:1008939104413
[2] 高天翔, 孙希福, 宋娜. 斑尾复 
GAO Tianxiang, SUN Xifu, SONG Na. Morphological variation analysis of seven populations of Synechogobius ommaturus[J]. Periodic Ocean Univ China, 2009, 39(1): 35-42. (in Chinese) doi: 10.3969/j.issn.1672-5174.2009.01.024
[3] 丁峰元, 林龙山, 李建生, 等. 东海区北部小黄鱼生殖群体分布及与水团关系[J]. 自然资源学报, 2007, 22(6): 1013-1019. doi: 10.3321/j.issn:1000-3037.2007.06.019 DING Fengyuan, LIN Longshan, LI Jiansheng, et al. Relationship between red lip croaker (Larimichthys polyactis) spawning stock distribution and water masses dynamics in northern East China Sea region[J]. J Nat Resour, 2007, 22(6): 1013-1019. (in Chinese) doi: 10.3321/j.issn:1000-3037.2007.06.019
[4] 蒙子宁, 庄志猛, 金显仕, 等. 黄海和东海小黄鱼遗传多样性的RAPD分析[J]. 生物多样性, 2003, 11(3): 197-203. doi: 10.3321/j.issn:1005-0094.2003.03.003 MENG Zining, ZHUANG Zhimeng, JIN Xianshi, et al. Genetic diversity in small yellow croaker (Pseudosciaena polyactis) by RAPD analysis[J]. Biodivers Sci, 2003, 11(3): 197-203. (in Chinese) doi: 10.3321/j.issn:1005-0094.2003.03.003
[5] 许广平, 仲霞铭, 丁亚平, 等. 黄海南部小黄鱼群体遗传多样性研究[J]. 海洋科学, 2005, 29(11): 34-38. doi: 10.3969/j.issn.1000-3096.2005.11.009 XU Guangping, ZHONG Xiaming, DING Yaping, et al. The research on genetic diversity of Pseudosciaena polyactis population from the southern part of the Yellow Sea[J]. Mar Sci, 2005, 29(11): 34-38. (in Chinese) doi: 10.3969/j.issn.1000-3096.2005.11.009
[6] 林龙山. 东海区小黄鱼现存资源量分析[J]. 海洋渔业, 2004, 26(1): 18-23. doi: 10.3969/j.issn.1004-2490.2004.01.004 LIN Longshan. Analysis on extant abundance of small yellow croaker Pseudosciaena polyactis in the East China Sea[J]. Mar Fish, 2004, 26(1): 18-23. (in Chinese) doi: 10.3969/j.issn.1004-2490.2004.01.004
[7] 张国政, 李显森, 金显仕, 等. 黄海中南部小黄鱼生物学特征的变化[J]. 生态学报, 2010, 30(24): 6854-6861. https://d.wanfangdata.com.cn/periodical/Ch9QZXJpb2RpY2FsQ0hJTmV3UzIwMjQxMTA1MTcxMzA0Eg1zdHhiMjAxMDI0MDIxGghhZGZtcmlkag%3D%3D ZHANG Guozheng, LI Xiansen, JIN Xianshi, et al. Changes of biological characteristics of small yellow croaker (Larimichthys polyactis) in the central and southern Yellow Sea[J]. Acta Ecological Sinica, 2010, 30(24): 6854-6861. (in Chinese) https://d.wanfangdata.com.cn/periodical/Ch9QZXJpb2RpY2FsQ0hJTmV3UzIwMjQxMTA1MTcxMzA0Eg1zdHhiMjAxMDI0MDIxGghhZGZtcmlkag%3D%3D
[8] 郭旭鹏, 金显仕, 戴芳群. 渤海小黄鱼生长特征的变化[J]. 中国水产科学, 2006, 13(2): 243-249. doi: 10.3321/j.issn:1005-8737.2006.02.013 GUO Xupeng, JIN Xianshi, DAI Fangqun. Growth variations of small yellow croaker (Pseudosciaena polyactis Bleeker) in the Bohai Sea[J]. J Fish Sci China, 2006, 13(2): 243-249. (in Chinese) doi: 10.3321/j.issn:1005-8737.2006.02.013
[9] 胡成建, 张晶. 南黄海族小黄鱼地方支族群洄游途径与环境关系的探讨[J]. 海洋渔业, 2005, 27(2): 109-112. doi: 10.3969/j.issn.1004-2490.2005.02.004 HU Chengjian, ZHANG Jing. Probe into the relationship between the migrating routes of endemic branch tribles of Larimichthys polyactis in the southern Yellow Sea and the environment[J]. Mar Fish, 2005, 27(2): 109-112. (in Chinese) doi: 10.3969/j.issn.1004-2490.2005.02.004
[10] 林龙山, 程家骅, 任一平, 等. 东海区小黄鱼种群生物学特性的分析[J]. 中国水产科学, 2004, 11(4): 333-338. doi: 10.3321/j.issn:1005-8737.2004.04.010 LIN Longshan, CHENG Jiahua, REN Yiping, et al. Analysis of population biology of small yellow croaker Pseudosciaena polyactis in the East China Sea region[J]. J Fish Sci China, 2004, 11(4): 333-338. (in Chinese) doi: 10.3321/j.issn:1005-8737.2004.04.010
[11] 薛莹, 金显仕, 张波, 等. 黄海中部小黄鱼的食物组成和摄食习性的季节变化[J]. 中国水产科学, 2004, 11(3): 237-243. doi: 10.3321/j.issn:1005-8737.2004.03.011 XUE Ying, JIN Xianshi, ZHANG Bo, et al. Diet composition and seasonal variation in feeding habits of small yellow croaker Pseudosciaena polyactis Bleeker in the central Yellow Sea[J]. J Fish Sci China, 2004, 11(3): 237-243. (in Chinese) doi: 10.3321/j.issn:1005-8737.2004.03.011
[12] XIAO Yongshuang, ZHANG Yan, GAO Tianxiang, et al. Genetic diversity in the mtDNA control region and population structure in the small yellow croaker Larimichthys polyactis[J].Environ Biol Fish, 2009, 85(4): 303-314. doi: 10.1007/s10641-009-9497-0
[13] 刘名, 王艳君, 高天翔, 等. 中日太平洋鲱形态学比较研究[J]. 中国海洋大学学报, 2007, 37(增刊): 131-136. https://xueshu.baidu.com/usercenter/paper/show?paperid=496fcfab6a86cb551692685ab8e94306&site=baike LIU Ming, WANG Yanjun, GAO Tianxiang, et al. Morphological comparison of Pacific herring Clupea pallasii in China and Japan[J]. Periodic Ocean Univ China, 2007, 37(Suppl): 131-136. (in Chinese) https://xueshu.baidu.com/usercenter/paper/show?paperid=496fcfab6a86cb551692685ab8e94306&site=baike
[14] 高天翔, 杨天燕. 中、日青鳞小沙丁鱼形态学比较分析[J]. 中国海洋大学学报, 2008, 38(2): 201-206. doi: 10.3969/j.issn.1672-5174.2008.02.005 GAO Tianxiang, YANG Tianyan. Comparison of morphological characteristics of Japanese Sardinella (Sardinella Zunasi) in China and Japan[J]. Periodic Ocean Univ China, 2008, 38(2): 201-206. (in Chinese) doi: 10.3969/j.issn.1672-5174.2008.02.005
[15] MAURO J C, LEANDRO R M, PAULO R D. Landmark-based morphometric analysis in selected species of Serranid fishes (Perciformes: Teleostei)[J]. Zool Stud, 1999, 38(3): 287-294. https://www.researchgate.net/publication/241594250_Landmark-based_Morphometric_Analysis_in_Selected_Species_of_Serranid_Fishes_Perciformes_Teleostei
[16] MAYR E, LINSLEY E G, USINGER R L. Methods and principles of systematic zoology[M]. New York, Toronto and London: McGraw Hill, 1953: 23-39, 123-154.
[17] RICKER W E. Computations and interpretation of biological statistics of fish populations[J]. Bull Fish Res Board Can, 1975, 191: 1-382.
[18] 刘勇, 程家骅, 陆健健. 利用Bootstrap统计方法探讨体长-体重关系中的幂指数对小黄鱼产卵期的指示作用[J]. 渔业科学进展, 2011, 32(2): 1-6. doi: 10.3969/j.issn.1000-7075.2011.02.001 LIU Yong, CHEN Jiahua, LU Jianjian. Testing of power b in exponent relationship between body length and weight of small yellow croaker as spawning indicator by bootstrap method[J]. Prog Fish Sci, 2011, 32(2): 1-6. (in Chinese) doi: 10.3969/j.issn.1000-7075.2011.02.001
[19] 朱元鼎. 中国石首鱼类分类系统的研究和新属新种的叙述[M]. 上海: 上海科技出版社, 1963: 70-71. ZHU Yuanding. Taxonomy system of Sciaendae and new species[M]. Shanghai: Shanghai Science and Technology Publishing House, 1963: 70-71. (in Chinese)
[20] EISENHOUR D J. Systematics of Macrhybopsis tetranema (Cypriniforms: Cyprinidae)[J]. Copeia, 1999(4): 969-980. doi: 10.2307/1447972
[21] GOLUBTSOV A S, BERENDZEN P B. Morphological evidence for the occurrence of two electric catfish(Malapterurus)species in the white nile and Omo-Turkana systems (East Africa)[J]. J Fish Biol, 1999, 55(3): 492-505. doi: 10.1111/j.1095-8649.1999.tb00694.x
[22] GIBSON A R, BAKER A J, MOEED A. Morphometric variation in introduced populations of the common myna (Acridotheres tristis): an application of the jackknife to principal component analysis[J]. Syst Zool, 1984, 33(4): 408-421. doi: 10.2307/2413092
[23] VOSS R S, MARCUS L F, ESCALANTE P. Morphological evolution in muroidrodents: I. Conservative patterns of craniometric covariance and their ontogenetic basis in the Neotropical genus Zygodontomys[J]. Evolution, 1990, 44(6): 1568-1587. doi: 10.2307/2409338
[24] 马爱军, 王新安, 雷霁霖, 等. 大菱鲆(Scophthalmus maximus)四个不同地理群体数量形态特征比较[J]. 海洋与湖沼2008, 39(1): 24-28. doi: 10.3321/j.issn:0029-814X.2008.01.004 MA Aijun, WANG Xin'an, LEI Jilin, et al. Statistic morphology difference among four turbot (Scophthalmus maximus) populations[J]. Oceanologia et Limnologia Sinica, 2008, 39(1): 24-28. (in Chinese) doi: 10.3321/j.issn:0029-814X.2008.01.004
[25] HAN Zhiqiang, LIN Longshan, SHUI Bonian, et al. Genetic diversity of small yellow croaker Larimichthys polyactis revealed by AFLP markers[J]. Afr J Agric Res, 2009, 4(7): 605-610. https://www.researchgate.net/publication/255589176_Genetic_diversity_of_small_yellow_croaker_Larimichthys_polyactis_revealed_by_AFLP_markers
[26] 丁士晟. 多元分析方法及其应用[M]. 长春: 吉林人民出版社, 1981: 259-315. DING Shisheng. Multivariate statistical method and application[M]. Changchun: Jilin People's Publishing House, 1981: 259-315. (in Chinese)
[27] 张晓庭, 方开泰. 多元统计分析引论[M]. 北京: 科学出版社, 1982: 393-403. ZHANG Xiaoting, FANG Kaitai. Multivariate statistical analysis[M]. Beijing: Science Press, 1982: 393-403. (in Chinese)
[28] 张岩, 肖永双, 高天翔, 等. 钝吻黄盖鲽不同群体形态学比较研究[J]. 渔业科学进展, 2010, 31(5): 15-21. doi: 10.3969/j.issn.1000-7075.2010.05.003 ZHANG Yan, XIAO Yongshuang, GAO Tianxiang, et al. Comparisons of morphological characteristics of different populations of marbled sole Pleuronectes yokohamae[J]. Prog Fish Sci, 2010, 31(5): 15-21. (in Chinese) doi: 10.3969/j.issn.1000-7075.2010.05.003
[29] AVISE J C, BALL R M. Principles of genealogical concordance in species concepts and biological taxonomy[J]. Oxf Surv Evol Biol, 1990, 7: 45-67.
[30] O'BRIEN S J, MAYR E. Bureaucratic mischief: recognizing endangered species and subspecies[J]. Science, 1991, 251(4998): 1187-1188. doi: 10.1126/science.251.4998.1187
[31] 刘效舜. 黄渤海区渔业资源调查与区划[M]. 北京: 海洋出版社, 1990: 191-200. LIU Xiaoshun. The fisheries resources investigation and division of the Yellow and Bohai Sea[M]. Beijing: Ocean Press, 1990: 191-200. (in Chinese)
-
期刊类型引用(3)
1. 刘明泰, 李杨, 刘小林, 许淑芬, 常亚青. 皱纹盘鲍SRAP反应体系的正交优化. 大连海洋大学学报. 2013(01): 12-16 .  百度学术
百度学术
2. 智艳平, 武喜艳, 安瑶瑶, 郜刚. 青枯菌SRAP-PCR体系的建立与优化. 山西师范大学学报(自然科学版). 2013(04): 69-72 . 百度学术
3. 程长洪, 张敏莹, 刘凯, 徐东坡, 段金荣, 周彦锋, 施炜纲. 暗纹东方鲀SRAP-PCR体系的建立与优化. 浙江农业学报. 2011(06): 1084-1089 . 百度学术
其他类型引用(0)


计量
- 文章访问数: 3965
- HTML全文浏览量: 169
- PDF下载量: 3024
- 被引次数: 3
 粤公网安备 44010502001741号
